5 challenges in developing conversational BI (part 1)
How to design conversational BI?
Our experience in developing the conversational BI can be interested in those who want to get to know what is conversational BI from our point of view or who is trying to make the same and leadings found can help avoid some mistakes or those who are thinking about creating an interface for getting BI analytics by using natural language.
Background of our project
We started developing a smart machine (digital assistant, virtual assistant, intelligent virtual assistant, chatbot, or bot, any name can be applied. We believe smart machine term can be an umbrella for all these terms) a few years back. The smart machine’s idea was to understand the natural language of the business users, understand the context of the IT support issues, and then solve these issues in enterprise software without invoking a human. While we developed that solution, we started more conversations with the companies interested in applying smart machines in the BI area. It was the main trigger for us to start think in that direction and start developing the conversational BI.
What is conversational BI in our point of view? Without going deeply into the long technology terms, in simple words, it is a smart machine that can understand the natural language via voice or text, understand the context of the query, integrate with the backend system or database, fetch the data, prepare data, and perform the data visualization on the screen.
The first challenge (Technical challenge)
The first and easiest challenge was:
- Understand the roles of the people who are using BI analytics
- Understand what they want to see on the screen;
- Understand where the data is stored;
- Understand how we can get the data from the APIs;
- Understand the transformation logic, if any, before display the data on the screen;
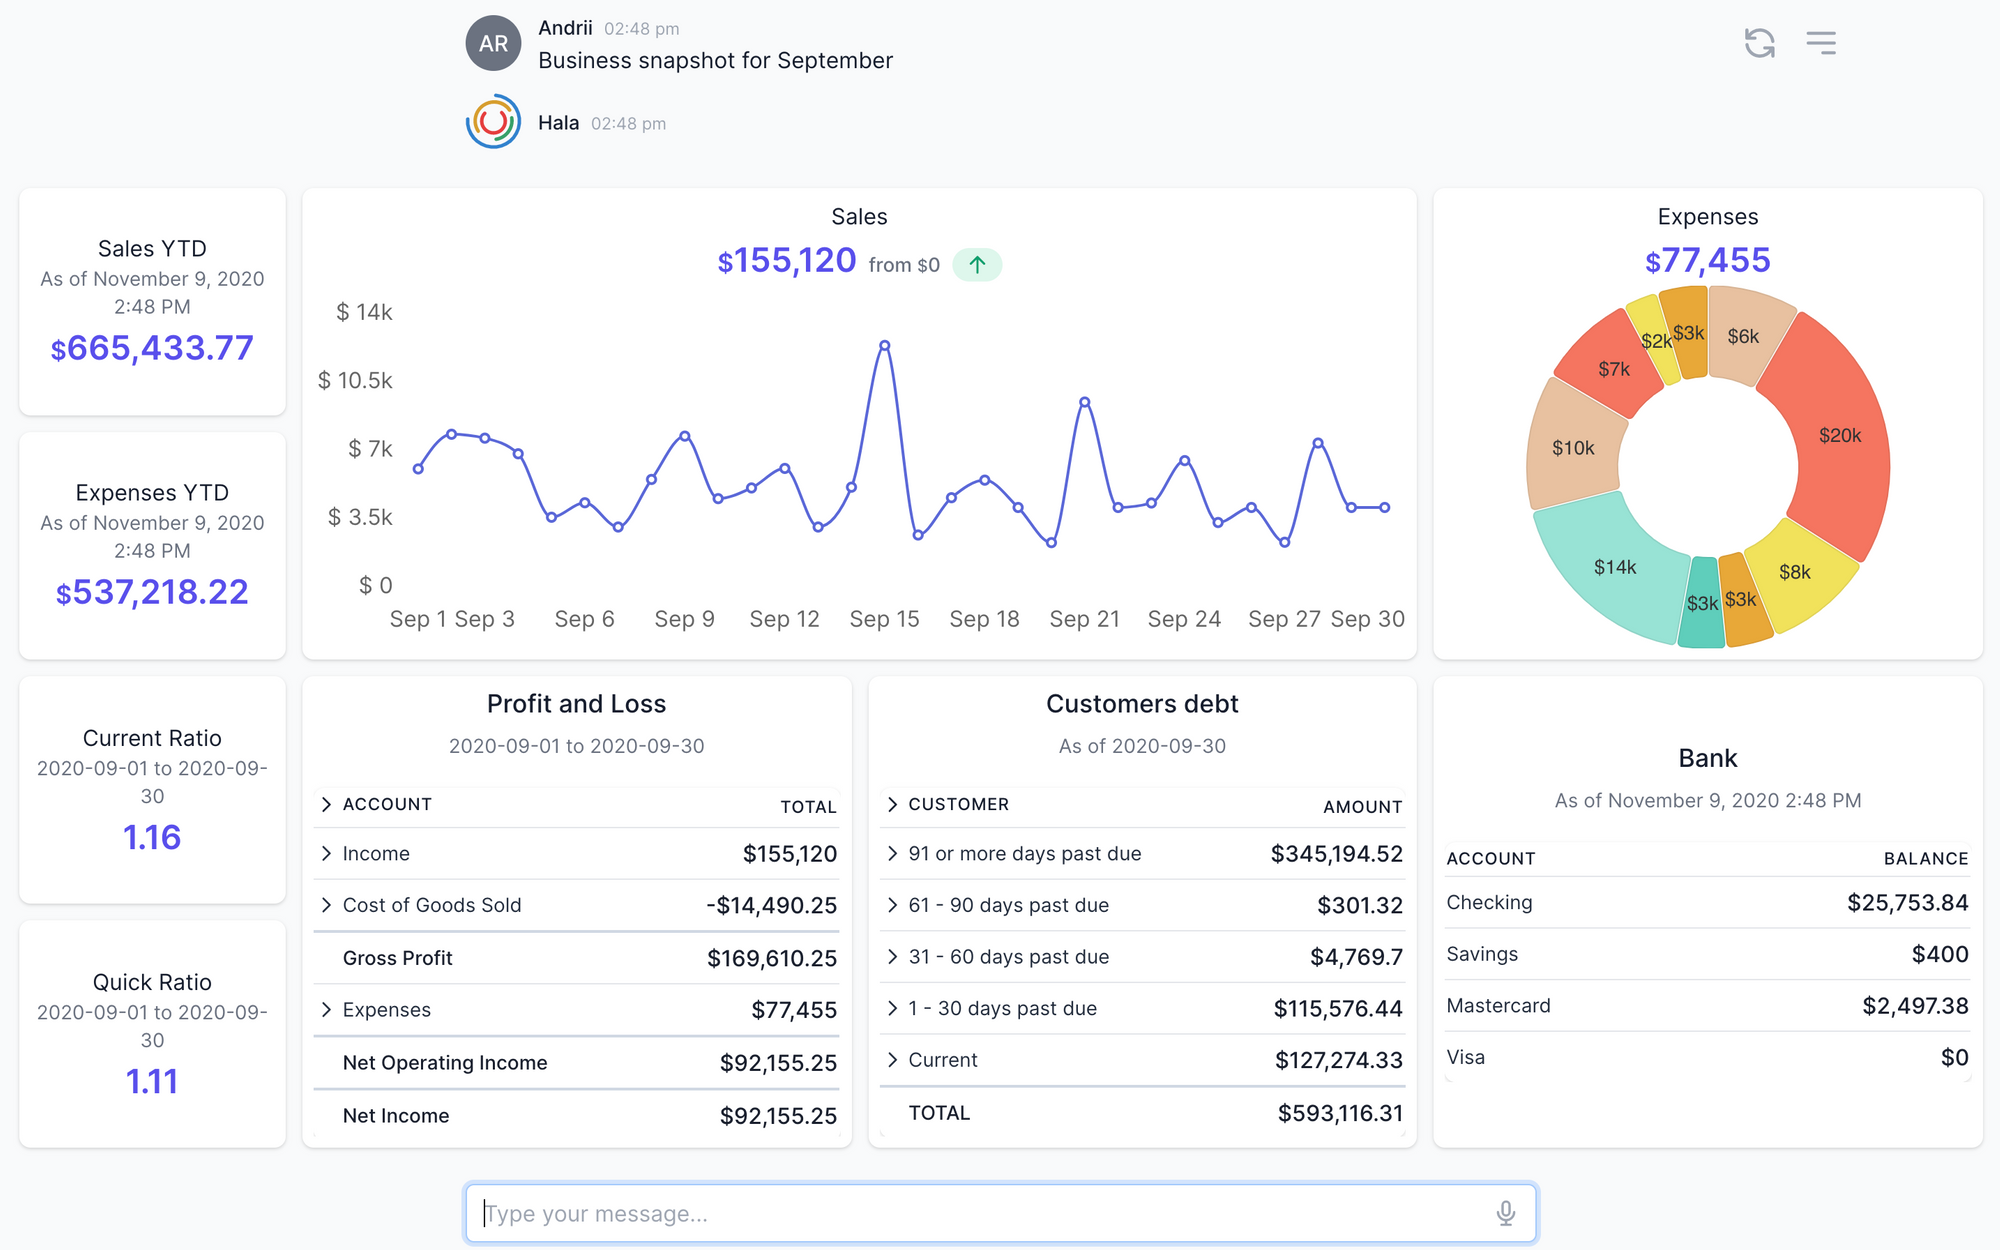
We contacted some companies, and we got answers to all of these questions, and we started from the simple dashboard for a business overview. This dashboard provides an overview of the business for a particular period.
Particularly this dashboard includes much important information about the business activities for SMEs (I am not talking about large corporates who need to see much more data with different views etc.). The dashboard includes year-to-date sales and expenses, financial ratios, current sales and expenses, P&L, outstanding debt, and balances for the bank accounts. Because you can see on the dashboard different information, we needed to use many APIs to collect all the data and then visualize it. In our case, we have used the next APIs:
- Profit and loss (filter by dates — this fiscal year-to-date)
- Profit and loss (filter by dates — requested period by the user)
- Balance sheet (filter by dates — requested period by the user)
- Financial ratios (we performed the calculation based on the Profit & Loss and Balance Sheet APIs);
- Items sales (filter by dates — requested period by the user)
- Expenses (we transformed the data from the Profit and Loss API);
- Aged AR (without filtering by dates);
- Bank (without filtering by dates);
As you can see, we need to use different APIs, and sometimes the source of the data can differ. For us, it wasn’t effective to use a third-party data warehouse that can consolidate the data in one place, plus perform some additional logic — we decided to create this layer from scratch. We simultaneously send the API into the different systems, aggregate the data, perform the logic, and then display the data on the screen. The cool part of this was that we had created a custom framework that allows us to do this and build in dashboards with APIs in a few hours. Also, because of such an approach, we are not storing the data on our side. We perform everything on the fly.
The first challenge was completed.
The second challenge (Data visualization and UI challenge)
Now we had all the data prepared. So we need to think about data visualization, and here we have spent much time. Because we were developing a custom solution, we could not use some ready-to-use third-party solutions covering this because we did not want to depend on them. Also, we didn’t find any ready-made solution that can fit our requirements.
We have tried many open source libraries and stoped our attention on recharts.org. With that library, we were able to build the charts, and then we started thinking about the overall UI of the dashboard, and here also we spent a lot of time looking for the right solution for us, and finally, we selected Tailwindcss.com. With those two components and APIs, we were able to build the next dashboard:
Of course, you would need to do a lot of internal work to adapt the UI to your needs, but it easier when you have a basis from which you can start.
The third challenge (NLP and syntax analysis challenges)
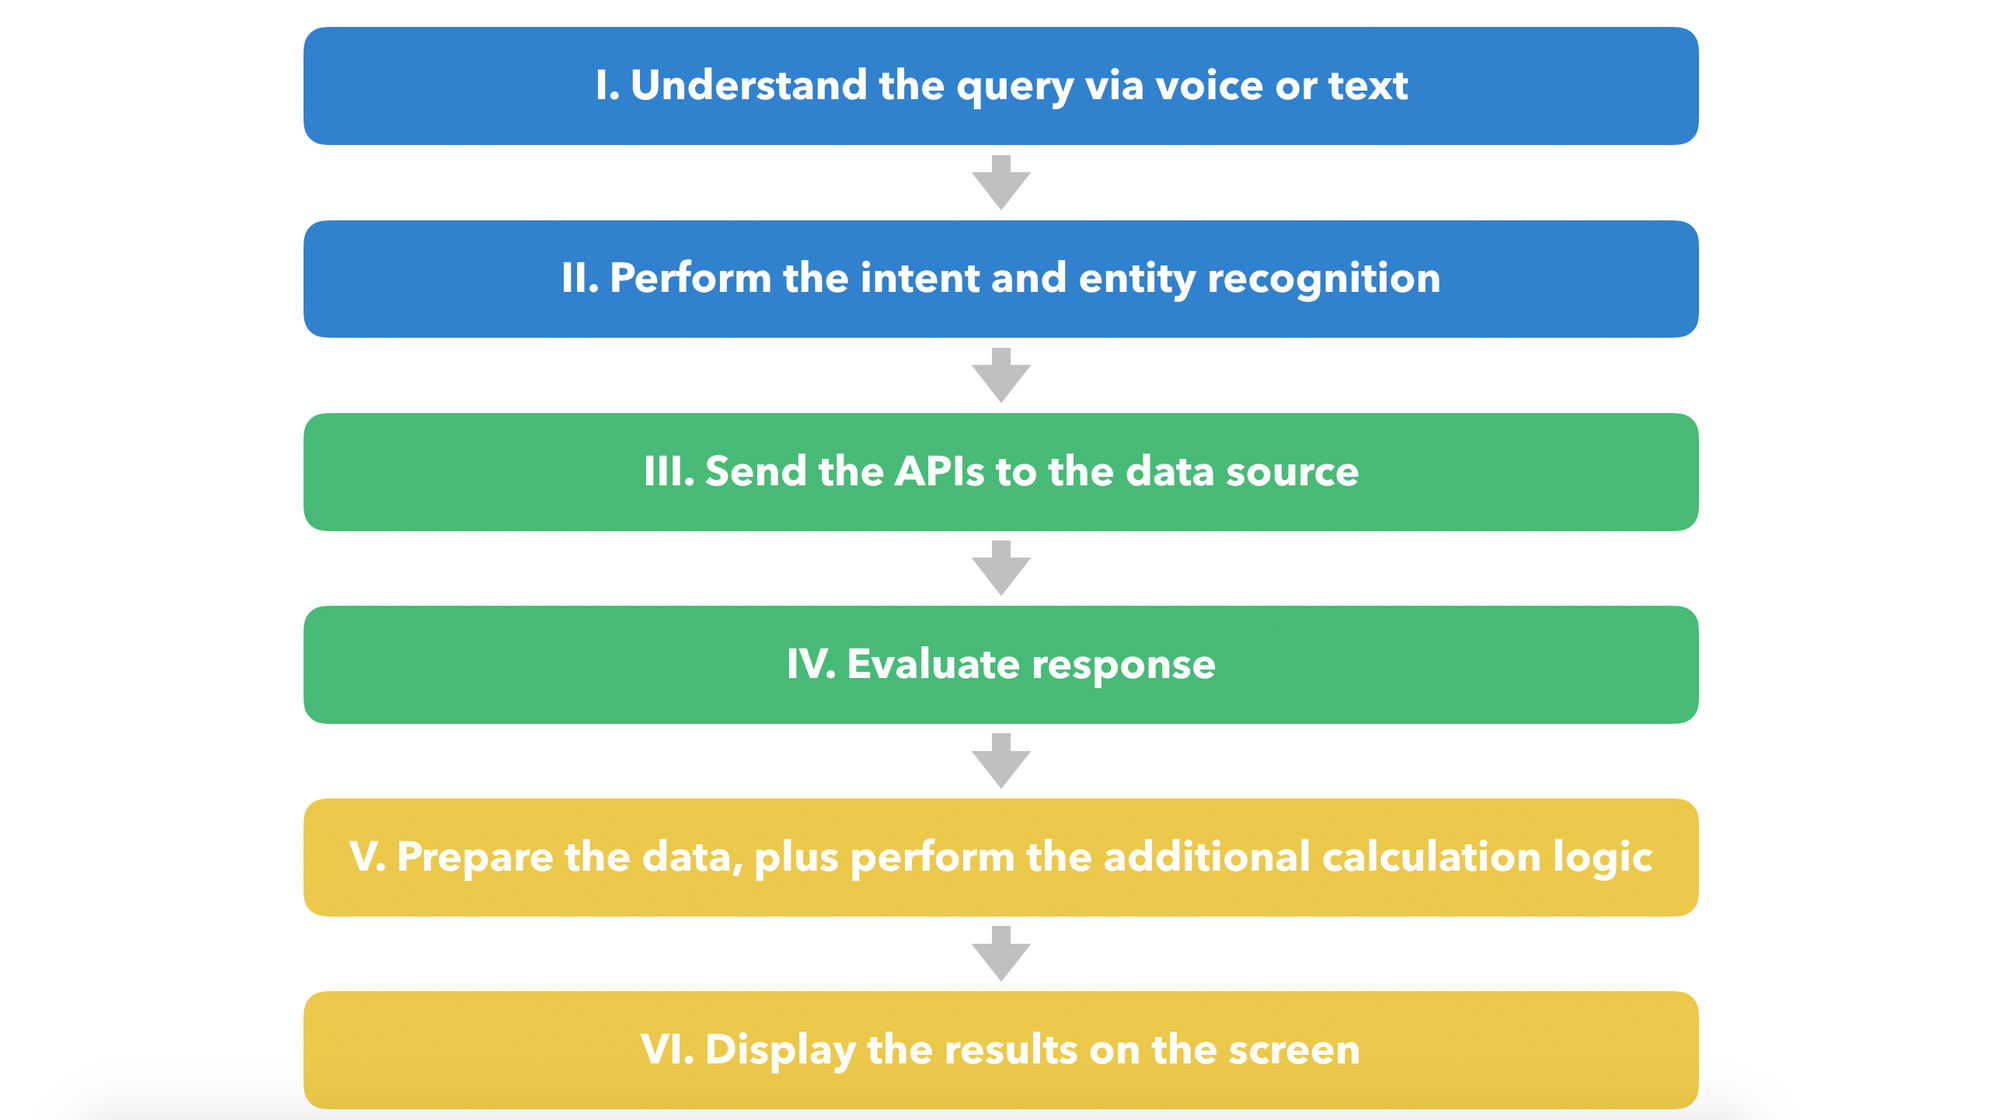
We have covered the BI challenges, and now we are moving to AI (NLP, ML, and syntax analysis challenge). What we planned to achieve here? The answer is next — We need to give the uses the possibility to use the natural language for getting the BI analytics. For example, if the user will say, “give me a business overview for the past month,” we need to do next:
We need to perform all of these steps as fast as possible, and we have achieved good results. On average, we need around 2–3 seconds to perform all of them (again, here we are talking about huge data sets with millions and millions of items).
To solve this challenge, you need to decide which framework for budding the smart machines you will use. You can easily get these technologies from AWS, IBM, Google, Microsoft. The same goes for startups who are building chatbot platforms. All of them will give the functionality to build the chatbots, use intents (utterances)&entities, and build conversation flow. In this topic, I do not want to go into how they are working or how to use them. I want to let you know that you need to have some technology to build a conversation between humans and machines. In our case, we have created our own framework.
Intents
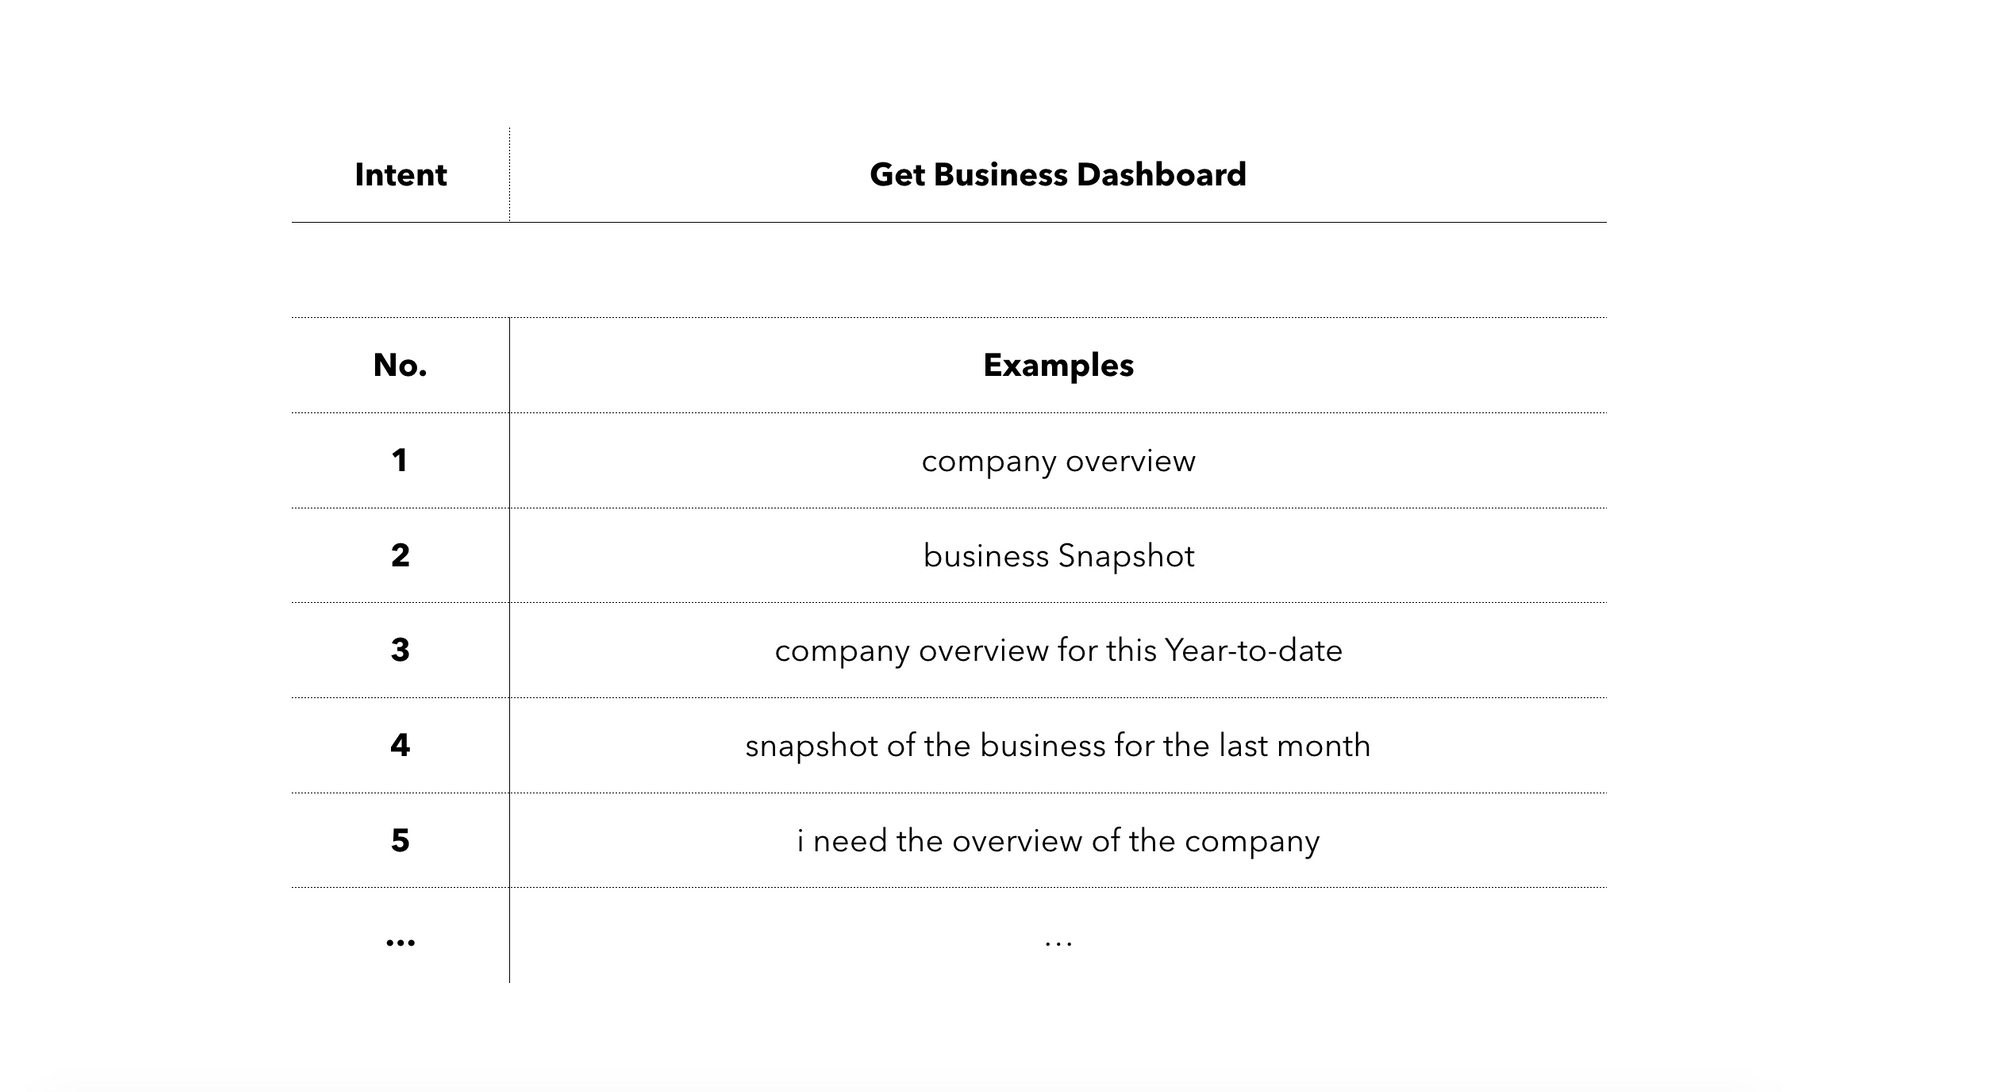
So at first, you can define the intents. Intents are the utterances from the users on how they can request the information. Please look at the image below. It will give you an overview of the intents.
Entities
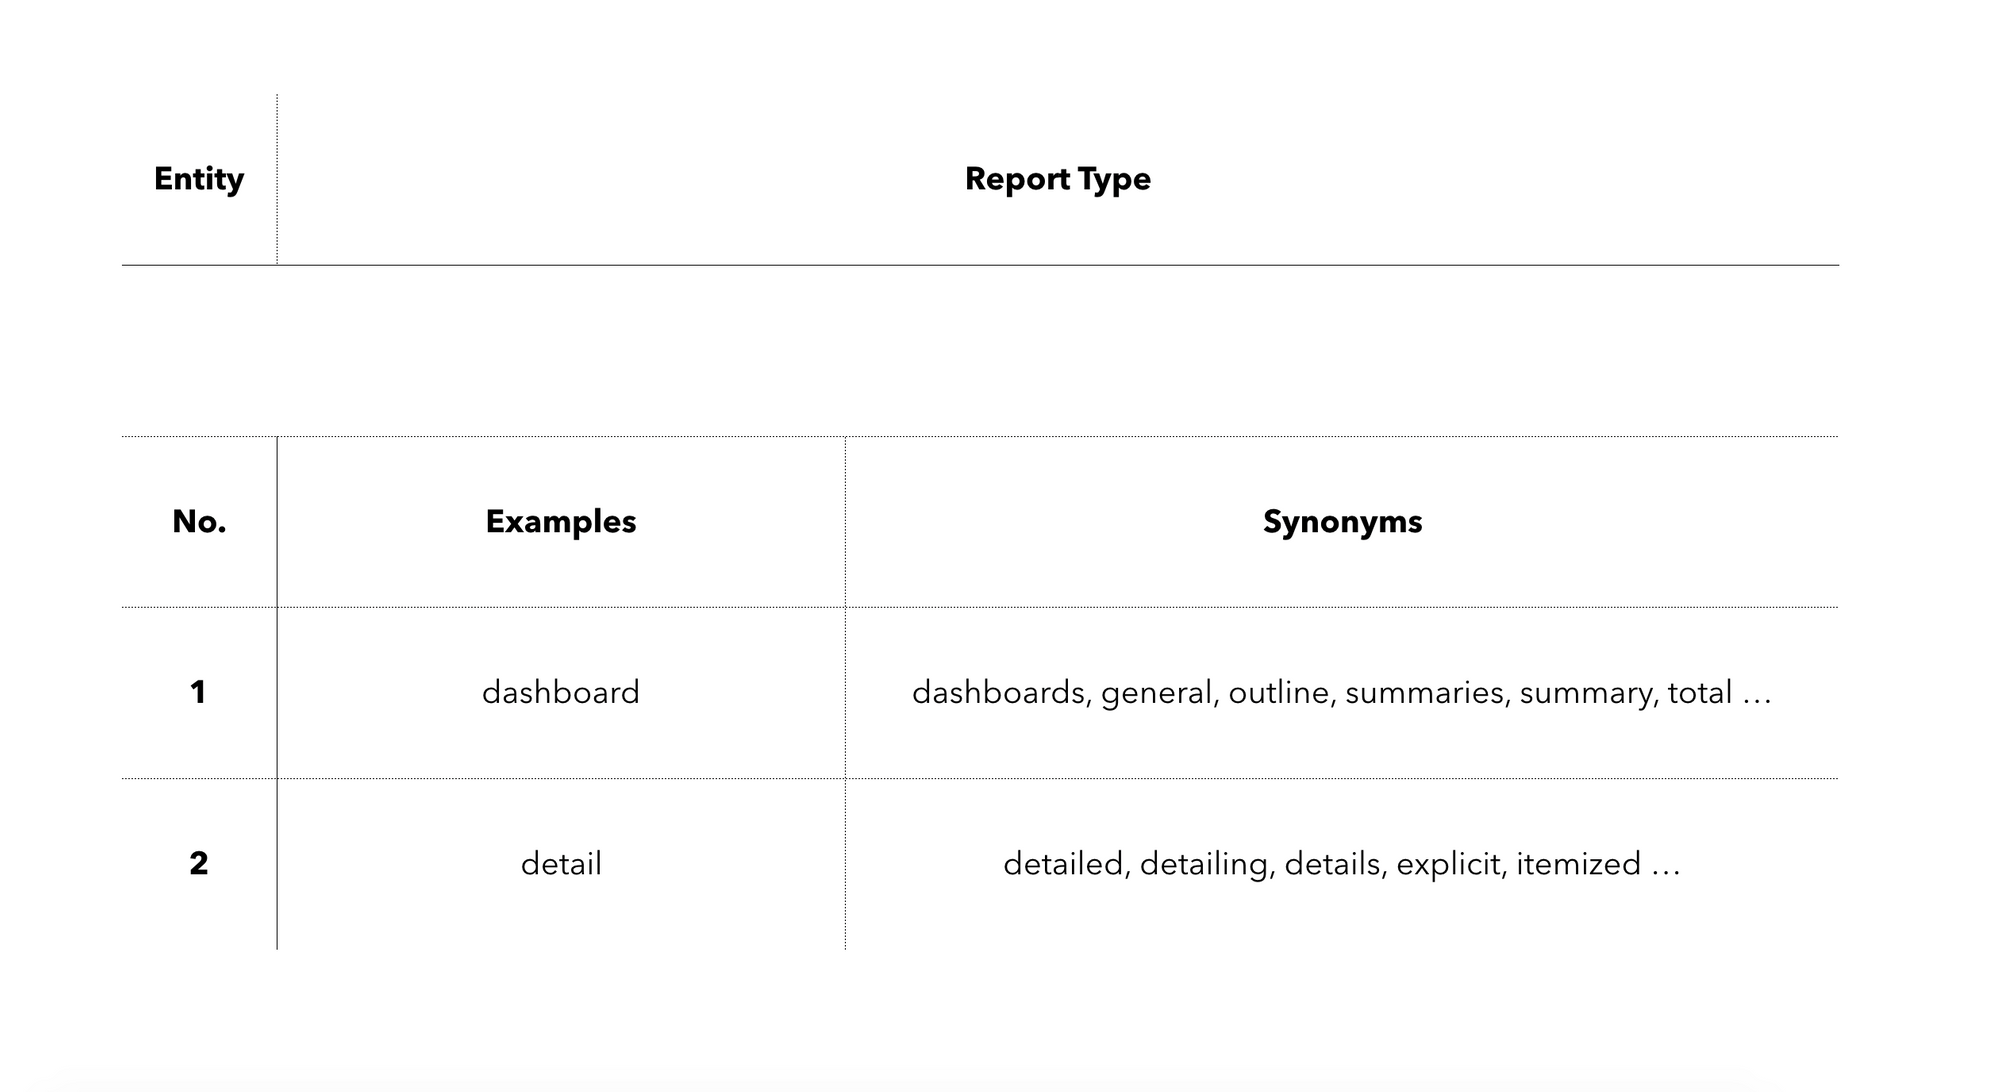
Now when you have trained the intents, in many cases, you would need to train entities. With entities, you can make keyword matching and, in our example, determine the dates and the type of the dashboard. For example, you have two types (views) of the dashboard: summary and detail. In this case, you can create two entities, for example, like on the image below:
With the entities, you can also understand the dates or periods that the user is looking for. There is no point in building them from scratch, and there are many open-source libraries that can determine the dates from the user query. For example, if the user will write “Business snapshot for October,” your smart machine should determine two dates, 01.10.2020 and 31.10.2020, or if the user writes “Business snapshot for the previous week,” again it should determine the two dates 16.11.2020 and 22.11.2020.
Next steps
So now, when you have intents and entities in place, you can build the conversation flow. Again, based on the chatbot framework, you will need to use their rules to build the conversation flow, but I want to share some learning in building the flow from the user’s perspective.
First version of the conversation flow
At first, we have designed the conversation flow as next (High-level overview without much details):
Example 1:
- When the user writes “business dashboard for October,” we can determine intent and entities;
- Because we have determined the intent and all entities, we do not need to ask additional questions. We can move to the next step;
- When we got all the input data, we can start the flow and collect the data and then visualize the data;
Example 2:
- When the user writes “business overview,” we can determine only intent;
- Because we have two entities that we need to fill out, we decided to ask users additional questions, like this: “Please select the report type: Summary or Detailed,” and we provided few quick reply buttons, which can be pressed, or the user can make his own input. Then we ask the second question, “For which period do you want to see the information” and user needs to select from the proposed periods or input his own version, like “from 1st of January till 2nd of May” or “for October” and so on.
- When we got all the answers, we can start the flow and collect the data and then visualize the data;
What was wrong with such an approach? The bad side of such a conversation was that we need to ask additional questions, and many times, users do not want to reply to those questions. Basically, to get the analytics, they need to provide some information again and again. It was annoying, and in their opinion, smart machines need to prepare the data with the fastest way and limited information in place.
The second version of the conversation flow
From experience, we have decided to make some changes in the conversation flow.
Example 1 (this example did not change from the first version):
- When the user writes “business dashboard for October,” we can determine intent and entities;
- Because we have determined the intent and all entities, we do not need to ask additional questions. We can move to the next step;
- When we got all the input data, we can start the flow and collect the data and then visualize the data;
Example 2:
- When the user writes “business overview,” we can determine only intent;
- When we have determined only the intent, we automatically decided to move to the next step without asking additional questions. With this approach, we need to determine the values automatically. Because we have two types of dashboard, we assume that if users didn’t specify which type of the report they want to see in their initial query, we could put the default value “Dashboard,” also when we make the APIs call, we need to send the dates to filter the data results and here we decided to put default values. In that case, we can assume that if you want to get the business dashboard, you want to get it for the current month. If the user didn’t provide the exact period for which they want to see the data, we are using the default value — current month.
- When we got all the data, we can start the flow and collect the data and then visualize the data;
Maybe as you read this, you can think that it is obvious that it is better to use the second version because the user can just say “business overview” and in few seconds get the results without providing any additional information. Still, while we built it, we thought that the first version mentioned version was more correct and better, but after communicating with the users, we are realized that it should be even simpler.
I hope all this information will help you!
Also, I plan to cover the last two challenges in my next article because this one is already so long (I thought that I would be able to cover all the challenges in one article, but while I wrote it, I realized that I have so many things to tell you :) )
Next challenges to cover:
The fourth challenge (The conversational and UI challenge on working with a dashboard without clicking the buttons)
The fifth challenge (The most complicated challenge on performing the data analysis. Asking the smart machine the following questions like: “Why we have such a low revenue?” or “Why the outstanding debt is so big?” or “Revenue prediction”)
To be continued…