Skill
Profit and Loss Comparison
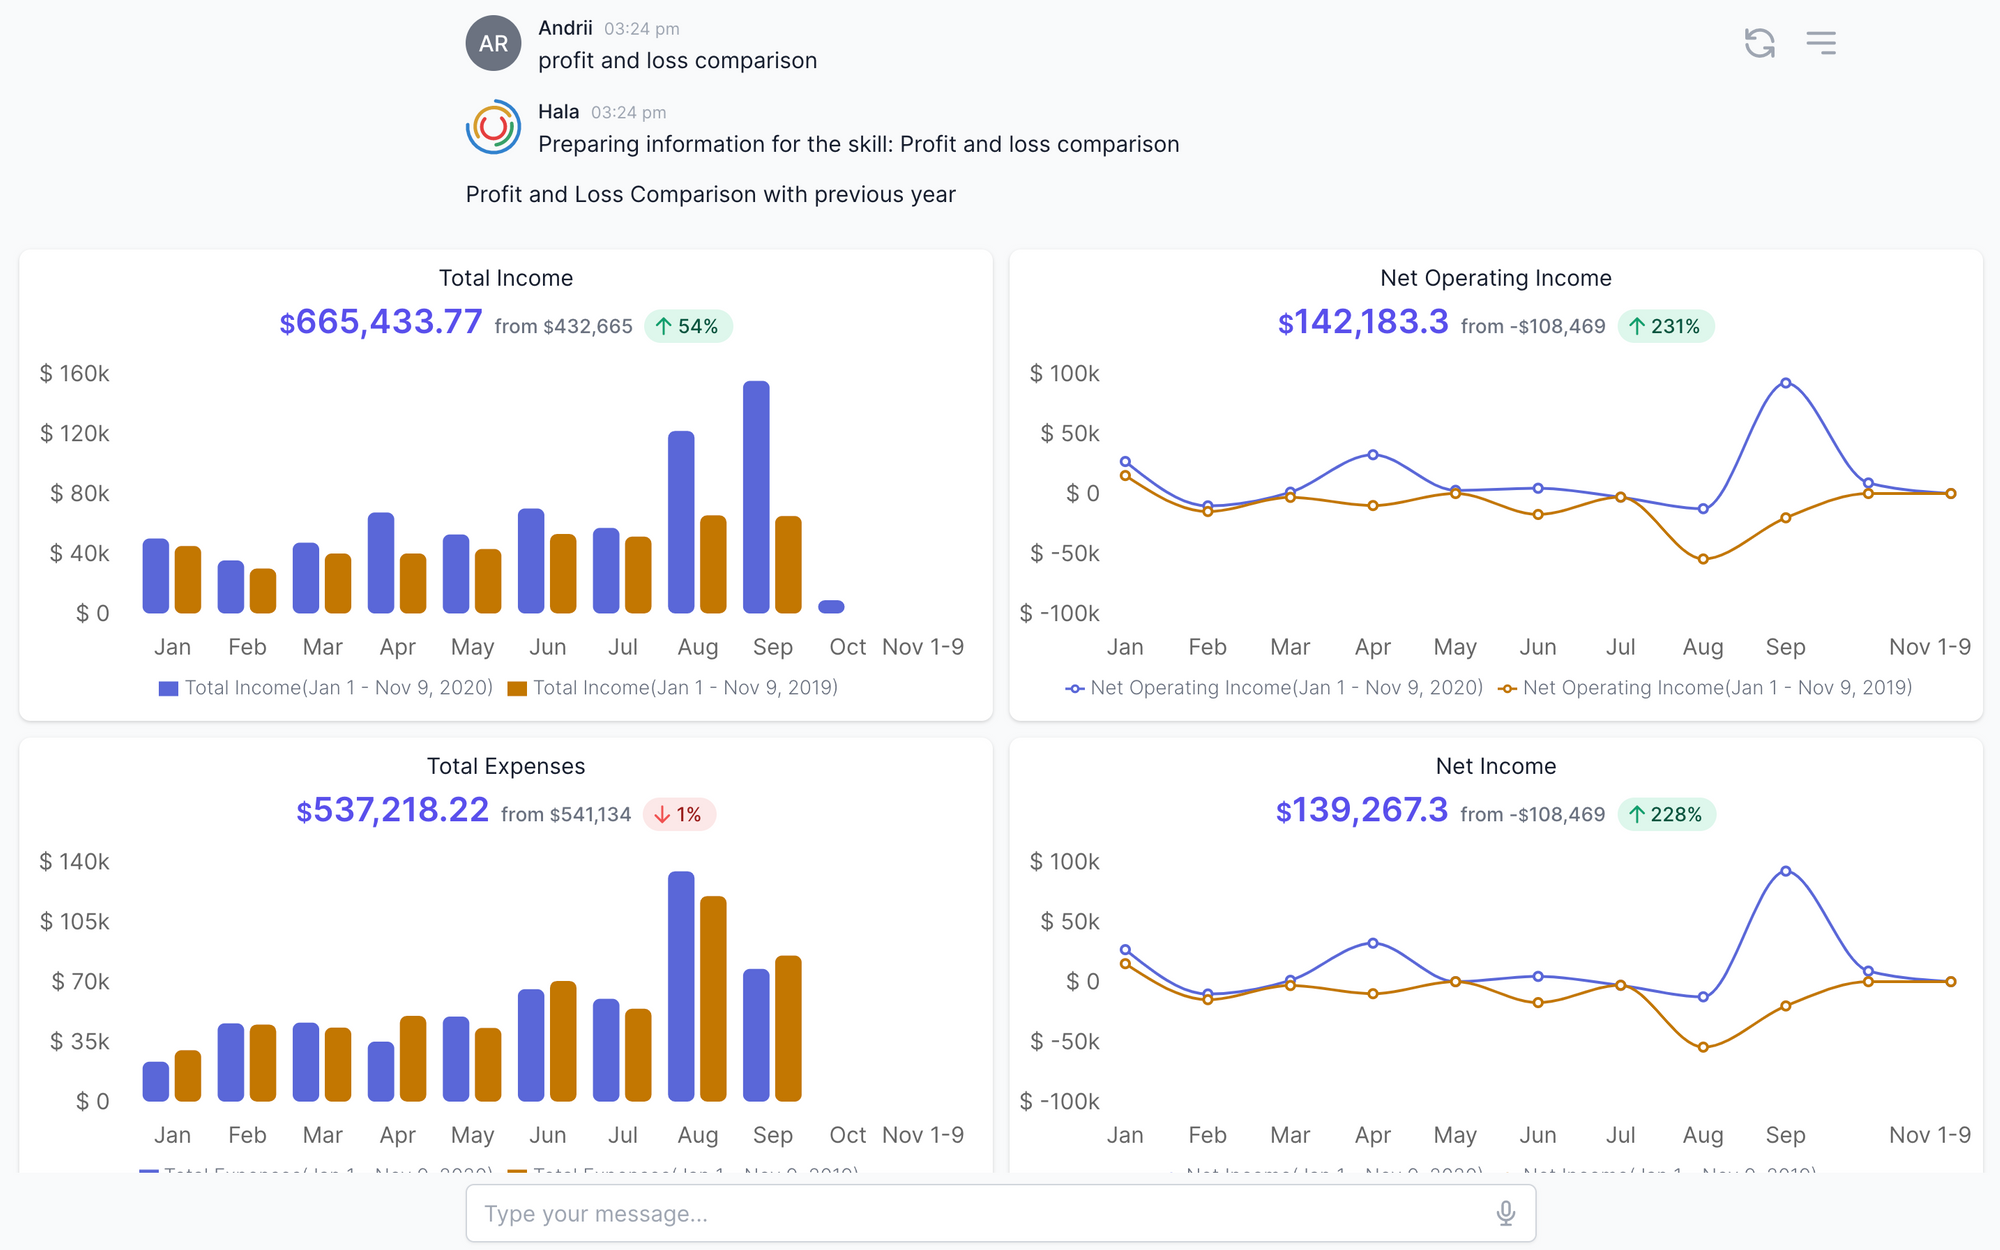
Report profit and loss comparison includes the income, expenses, operating income, and net income comparison graphs. Ger reports from the QuickBooks Online via Hala Digital Assistant.
Dashboard elements
The dashboard includes the next sections:
- Total Income. Bar chart of total income for a requested period split by days/months/quarters in comparison with the previous year
- Total Expenses. Bar chart of total expenses for a requested period split by days/months/quarters in comparison with the previous year
- Net operating income. Line chart of total Net operating income for a requested period split by days/months/quarters in comparison with the previous year
- Net income. Line chart of total Net income for a requested period split by days/months/quarters in comparison with the previous year
- PL Comparison. Table that include the information about PL for a requested period in comparison with the same period of the previous year
How to use
As an example, you can use the next utterances to execute this skill:
Profit and loss comparison
PL compare
Compare PL of this month with the previous year
Default values
If you do not provide the period in your initial query, Hala will use the next period by default: This Fiscal Year-to-date
Dashboard options
For each dashboard, Hala has additional options that can be executed by users when they see the dashboard
- Change the dates - Allows you to change the dates for the information represented on the dashboard.
Integration
This skill is by default available for the next enterprise software:
![]()