What is conversational BI
Conversational business intelligence (BI) refers to technologies, like chatbots or voice assistants, which users can talk to and get interactive visualizations (charts, reports, and dashboards) and business intelligence capabilities.
They use large volumes of data, machine learning, and natural language processing to help imitate human interactions, recognize speech and text inputs, integrate with databases or enterprise software, aggregate and consolidate the data, and provide the users' output.
Conversational BI use cases
In most cases, when people think of conversational artificial intelligence, they think about chatbots and virtual assistants. Today the most common use cases are implemented in customer support and IT support services.
The conversational BI technologies are going beyond the well-known areas of implementing conversational AI technologies. The main user of conversational BI is the User of business software of any organization in the world. In the business world, we need to consume many data for making everyday decisions, and the BI technologies are covering our needs.
The conversational BI technologies allow us to unite the BI technologies with the conversational AI technologies and provide the users' opportunity to use natural language to get the analytics or data and even explain the data displayed on the screen.
Despite its narrow focus, conversation BI is an extremely lucrative technology for enterprises, helping businesses more efficient. While customer support and IT support services are the most popular form of conversational AI, conversational BI opens up new implementation areas across the organizations. Some examples include:
Components of Conversational BI
Conversational BI combines three main components: natural language processing (NLP) with machine learning, data visualization (Conversational UI), and a strong connection to databases or business software. Those three components are currently co-existing separately, and conversational BI technologies untie them into one peace for extracting even more synergy from all of them.
- Machine Learning (ML) is a sub-field of artificial intelligence, made up of a set of algorithms, features, and data sets that continuously improve themselves with experience. As the input grows, the AI platform machine gets better at recognizing patterns and uses it to make predictions. Natural language processing is the current method of analyzing language with the help of machine learning used in conversational AI.
Key responsibility: From one side, it allows the users to use natural language for a conversation with a machine, understand the input's meaning, understand the context, and learn repeatedly. On the other hand, it allows working with the data by analyzing it, building predictive models, performing data mining, and many more.
- Data. All the business activities are storing in databases, the amount of data is growing rapidly, and BI solutions allow the users to read the data. Companies can use many business software and, as a result, have many databases to work with.
Key responsibility: Collect, aggregate, clean up, analyze, transform of the data.
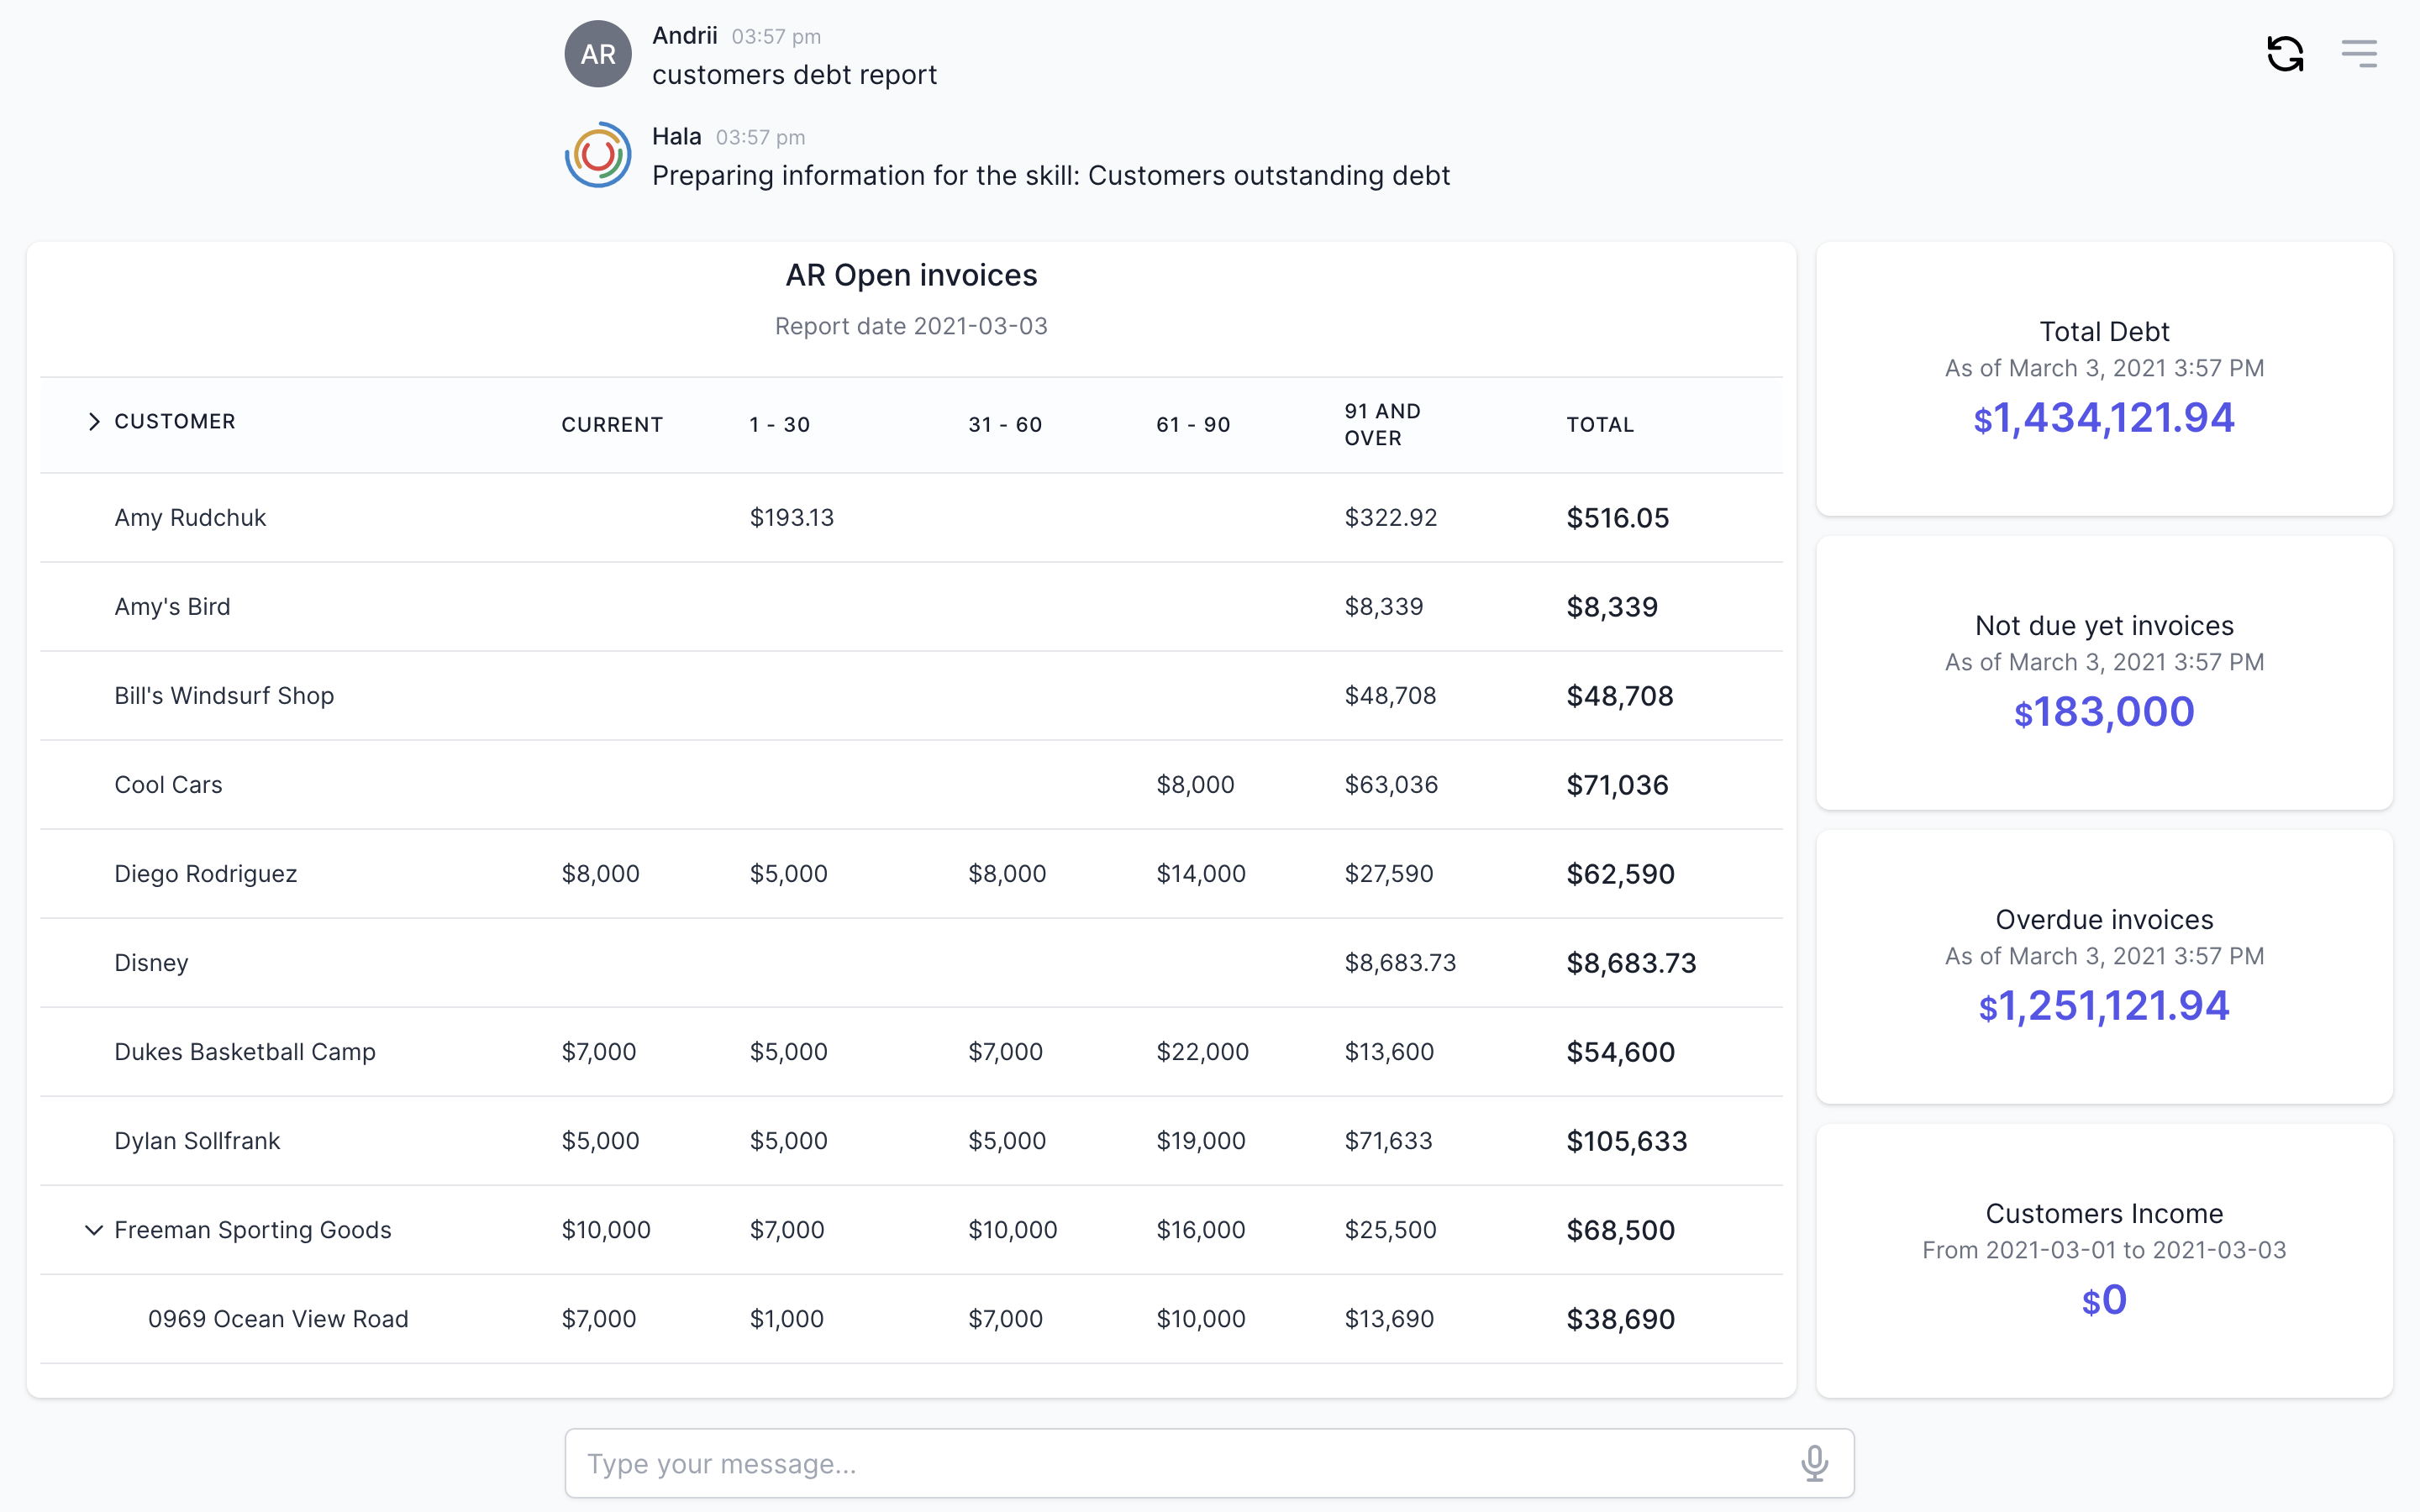
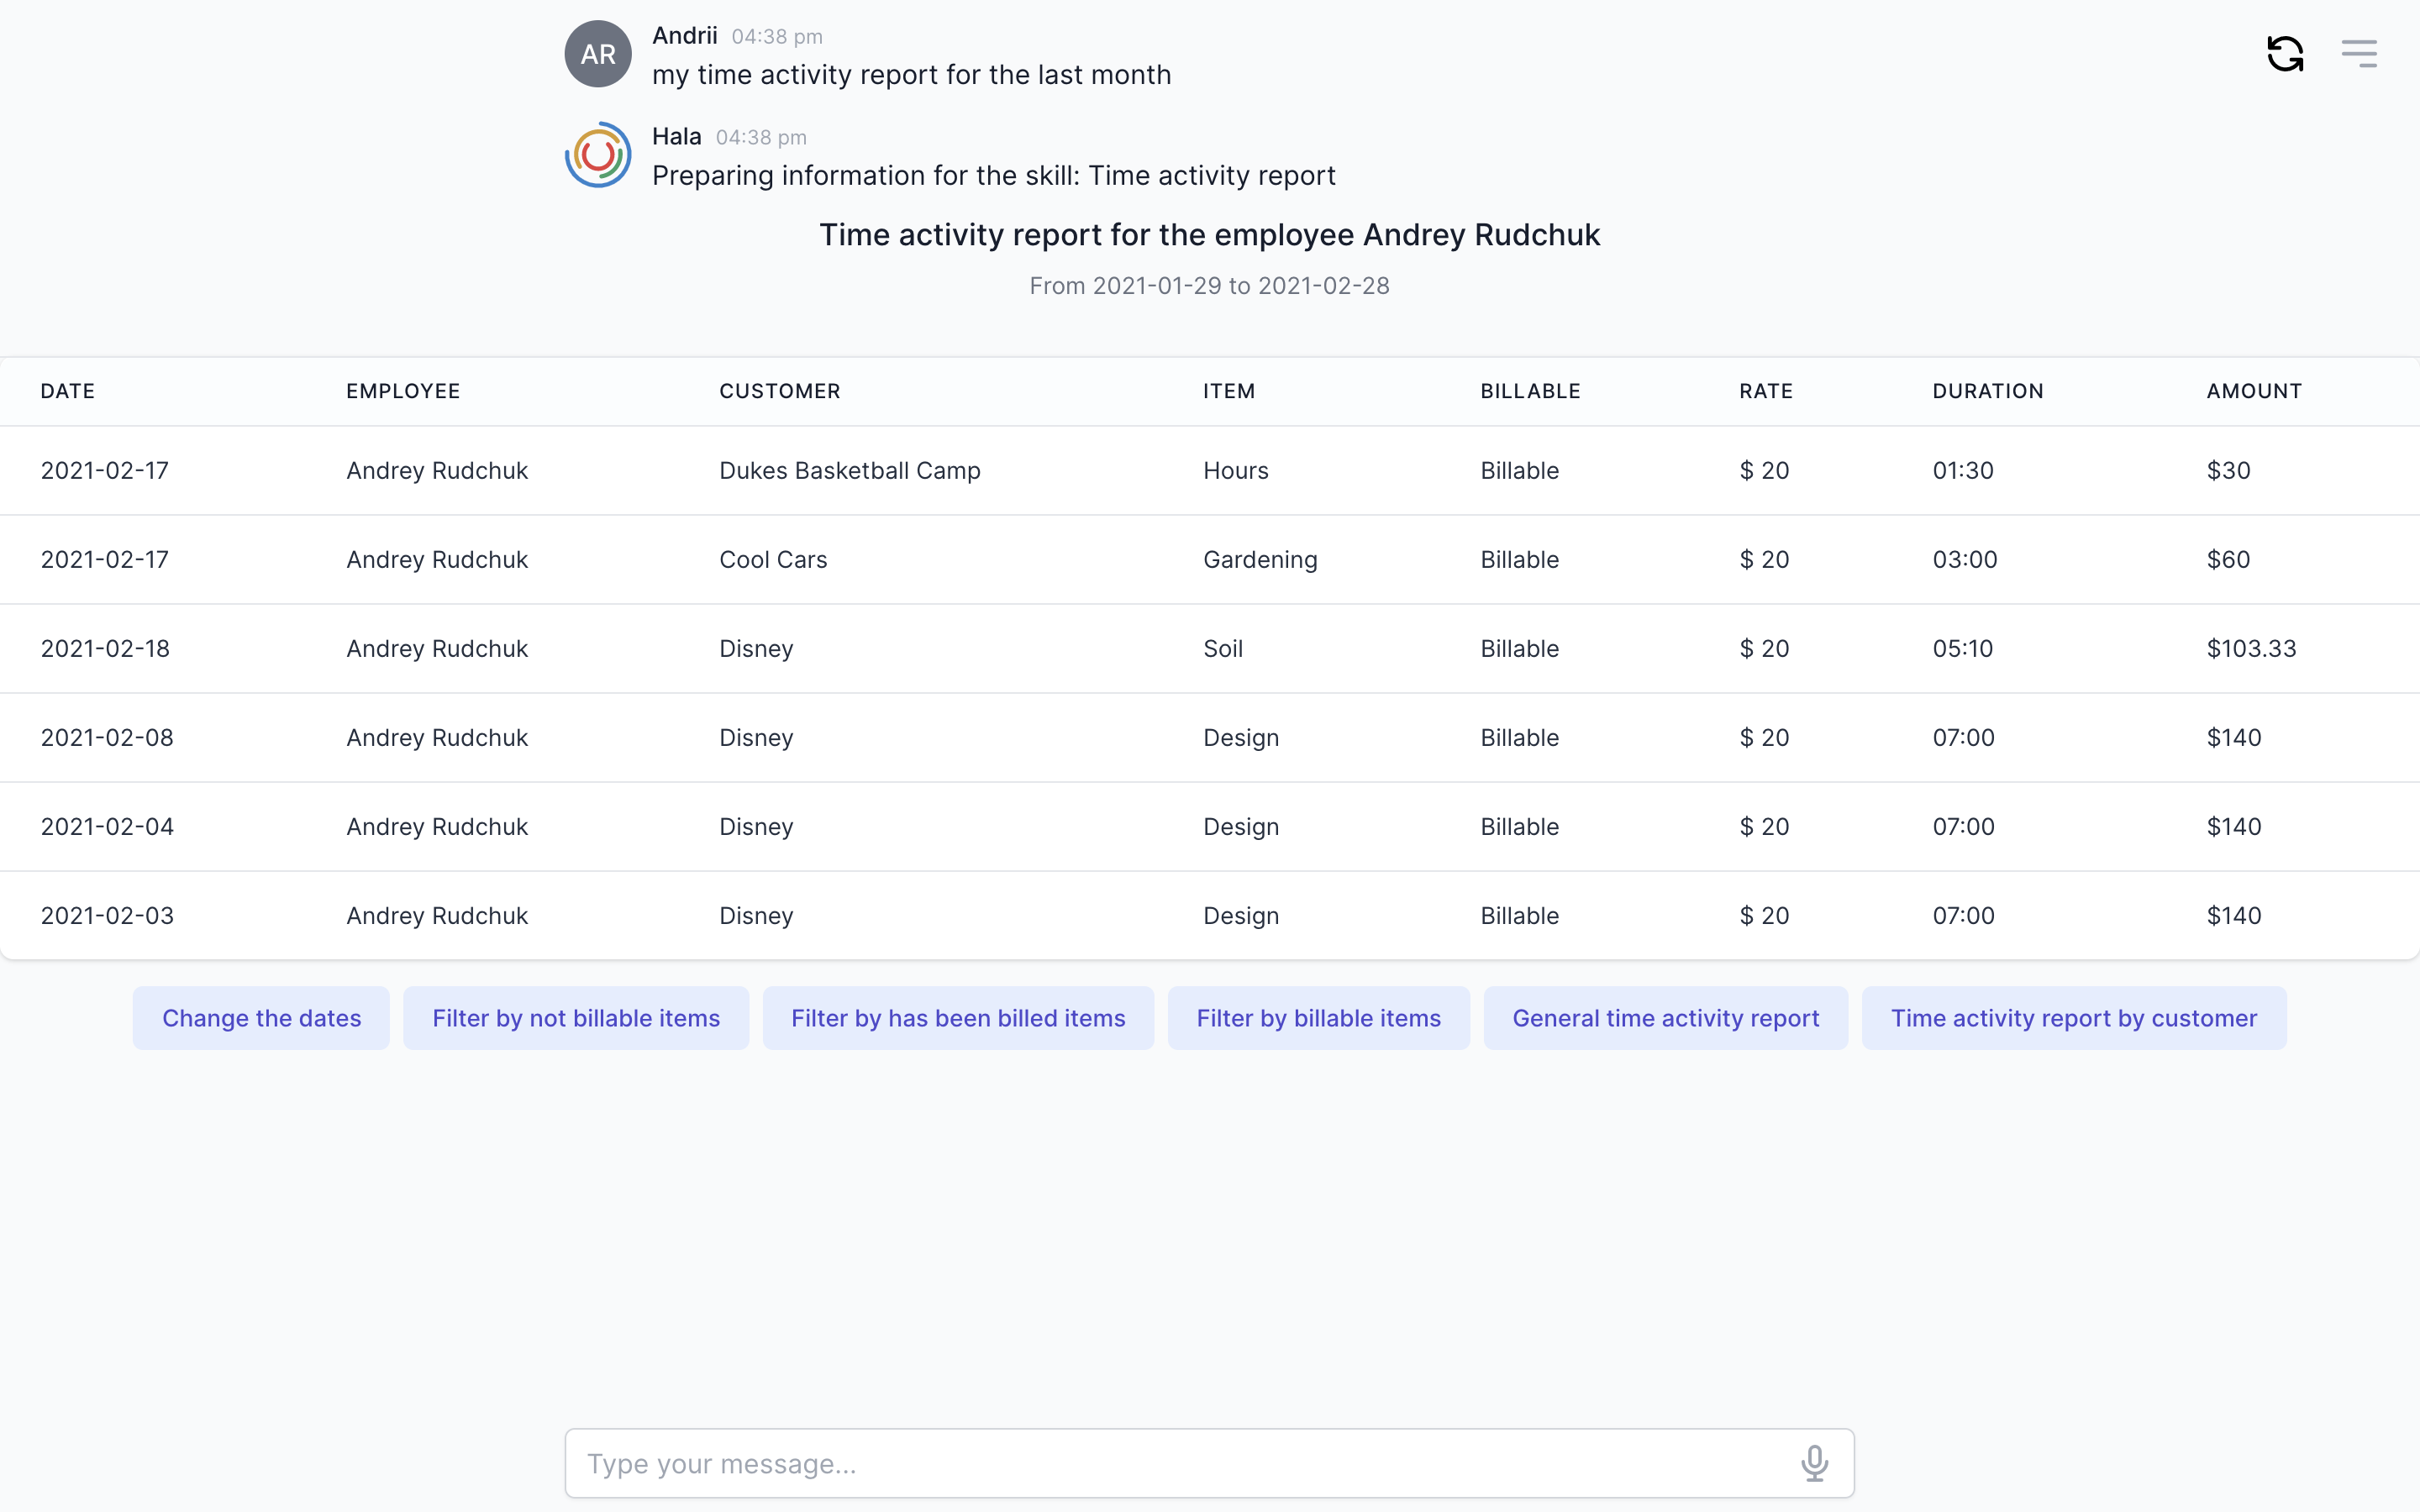
- Conversational UI. The enterprise-grade conversational user interface is an interface you can talk/write to in plain language and get a response from the chatbot in the form of dashboards, charts, reports, forms, tables, cards, lists, and many other UI components. In other words, conversational UI allows embedding the standard data visualization components into the chatbot conversations with the users.
Key responsibility: Provides the interface for working with the data, charts, reports, and other BI components.
Types of data visualizations
The conversational UI dashboards are effective data visualization tools for tracking and visualizing data from multiple data sources. Conversational UI include common visualization techniques, such as:
- Tables: This consists of rows and columns used to represent the data. Tables can show a great deal of information in a structured way and display the main columns inside the table and the rest columns in a detailed view.
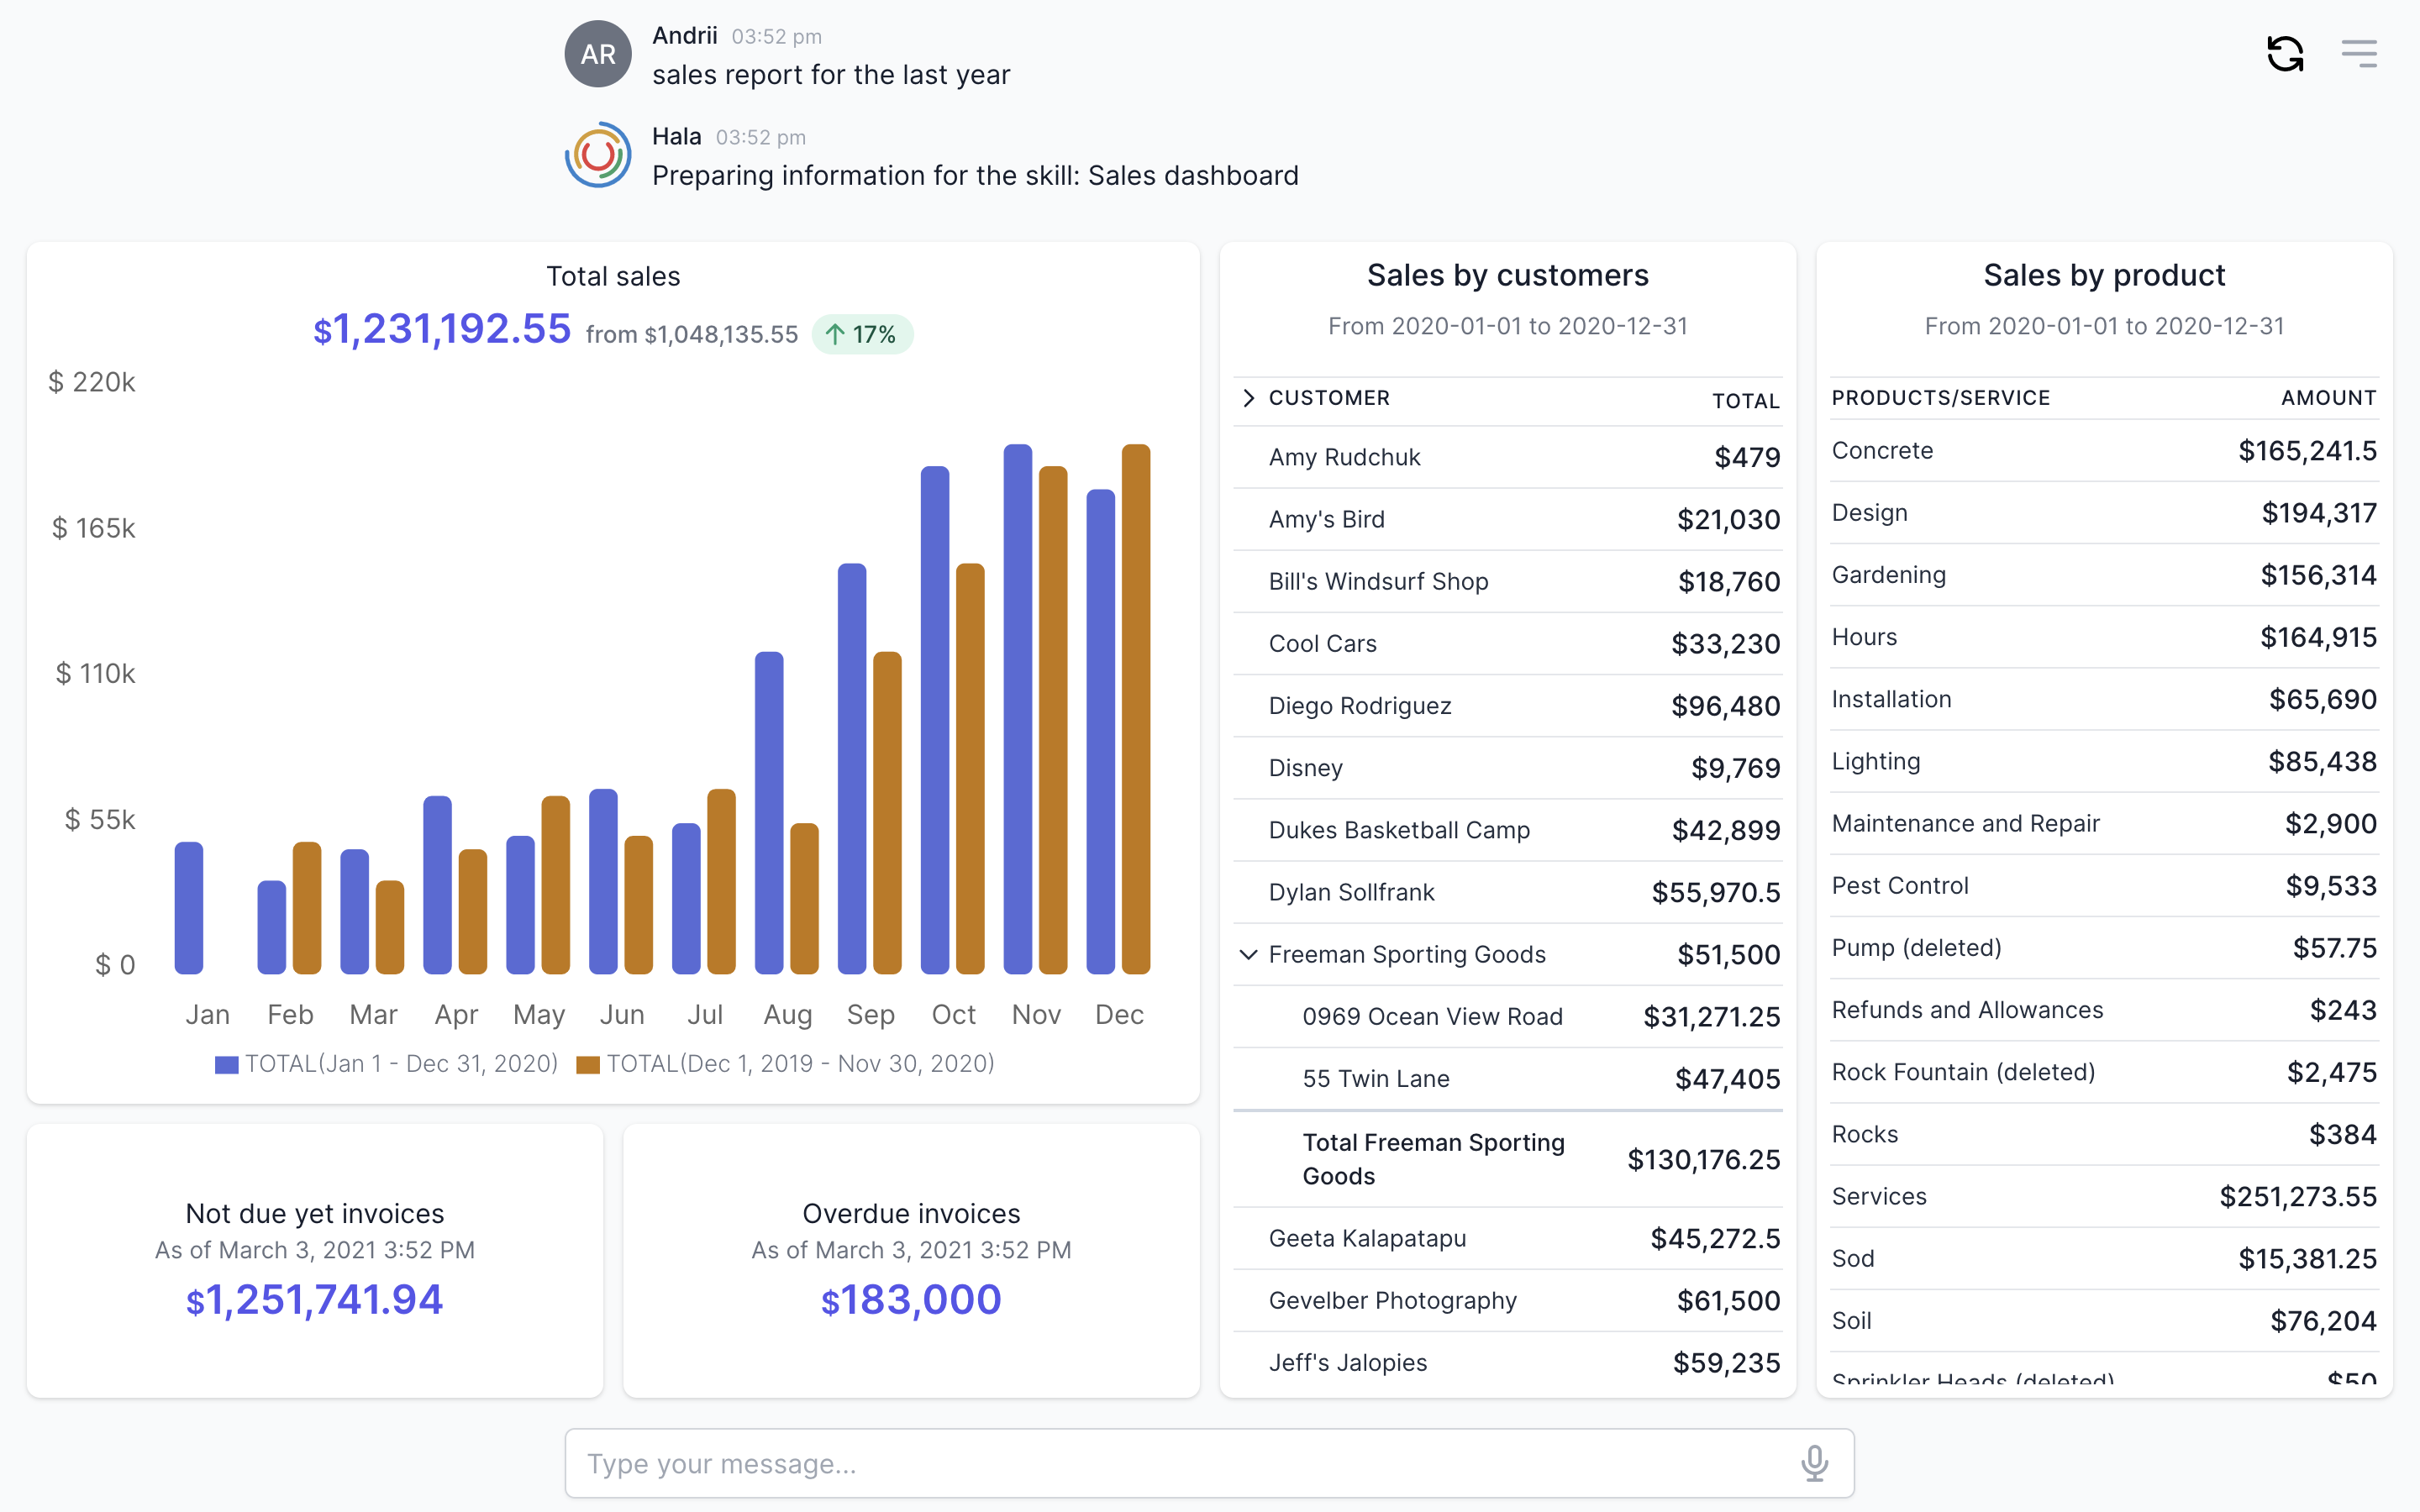
- Pie charts and stacked bar charts: These graphs are divided into sections representing parts of a whole. They provide a simple way to organize data and compare the size of each component to one another.
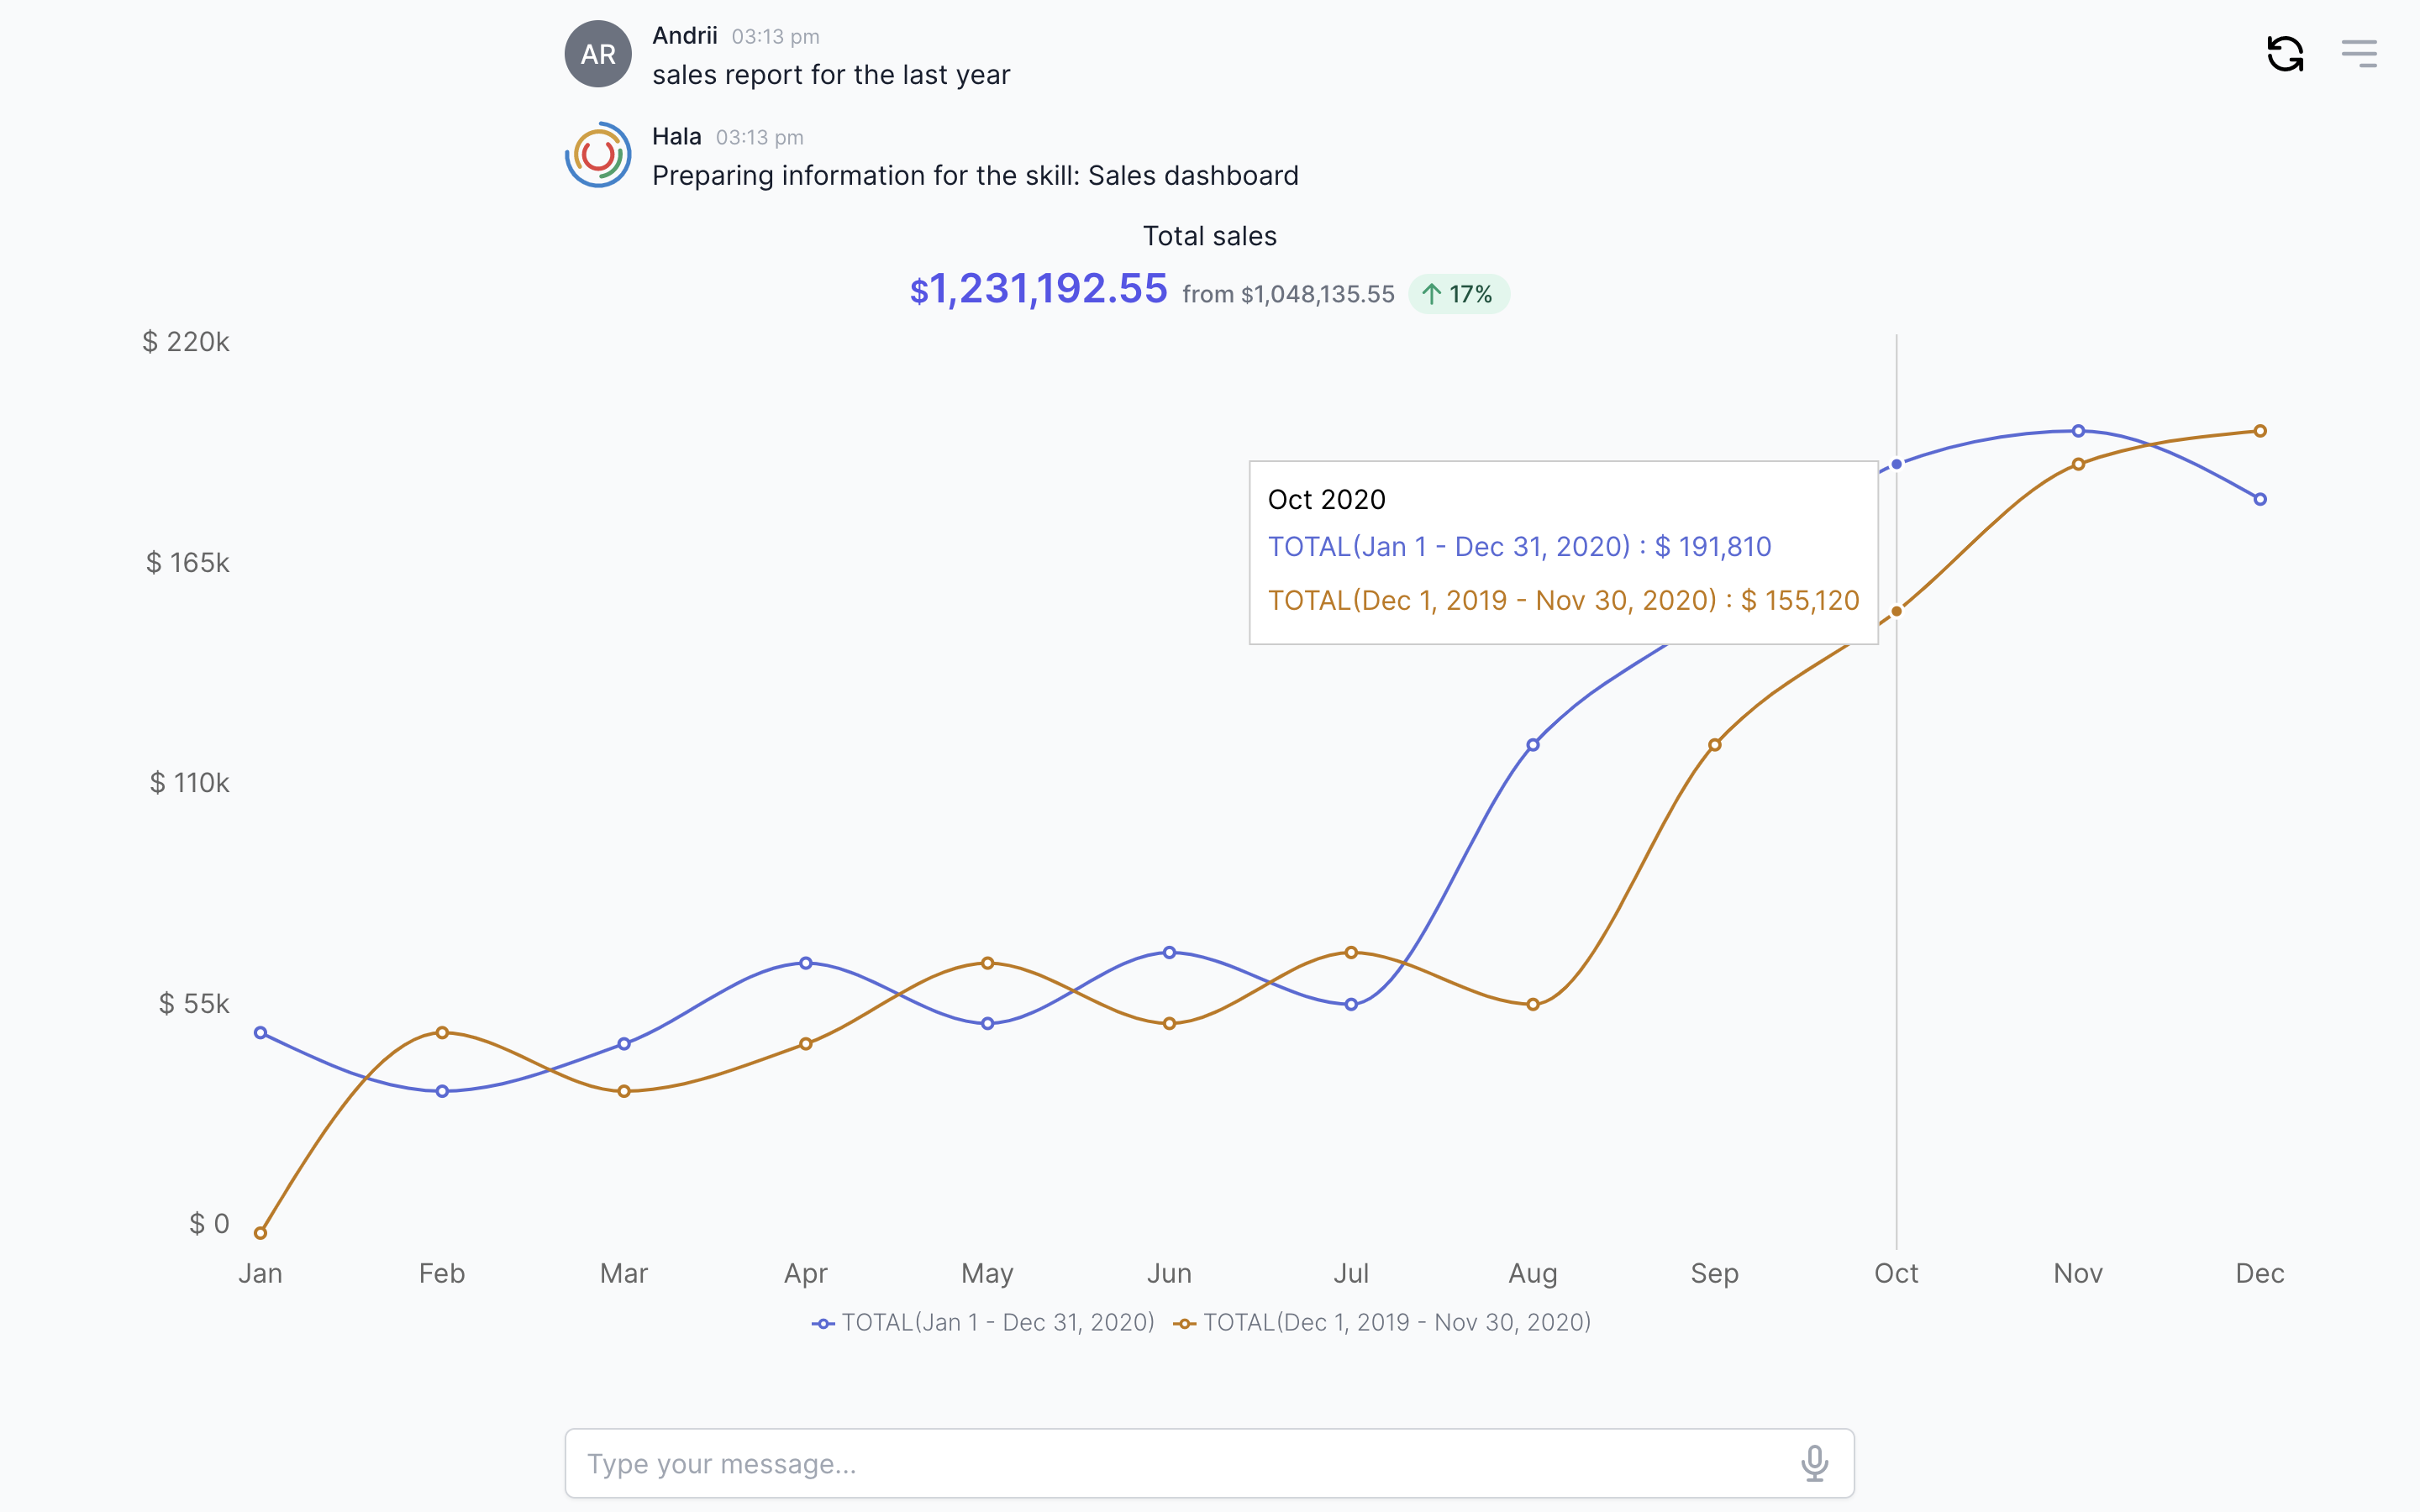
- Line graphs and area charts: These visuals show a change in one or more quantities by plotting a series of data points over time. Line graphs utilize lines to demonstrate these changes, while area charts connect data points with line segments, stacking variables on top of one another and using color to distinguish between variables.
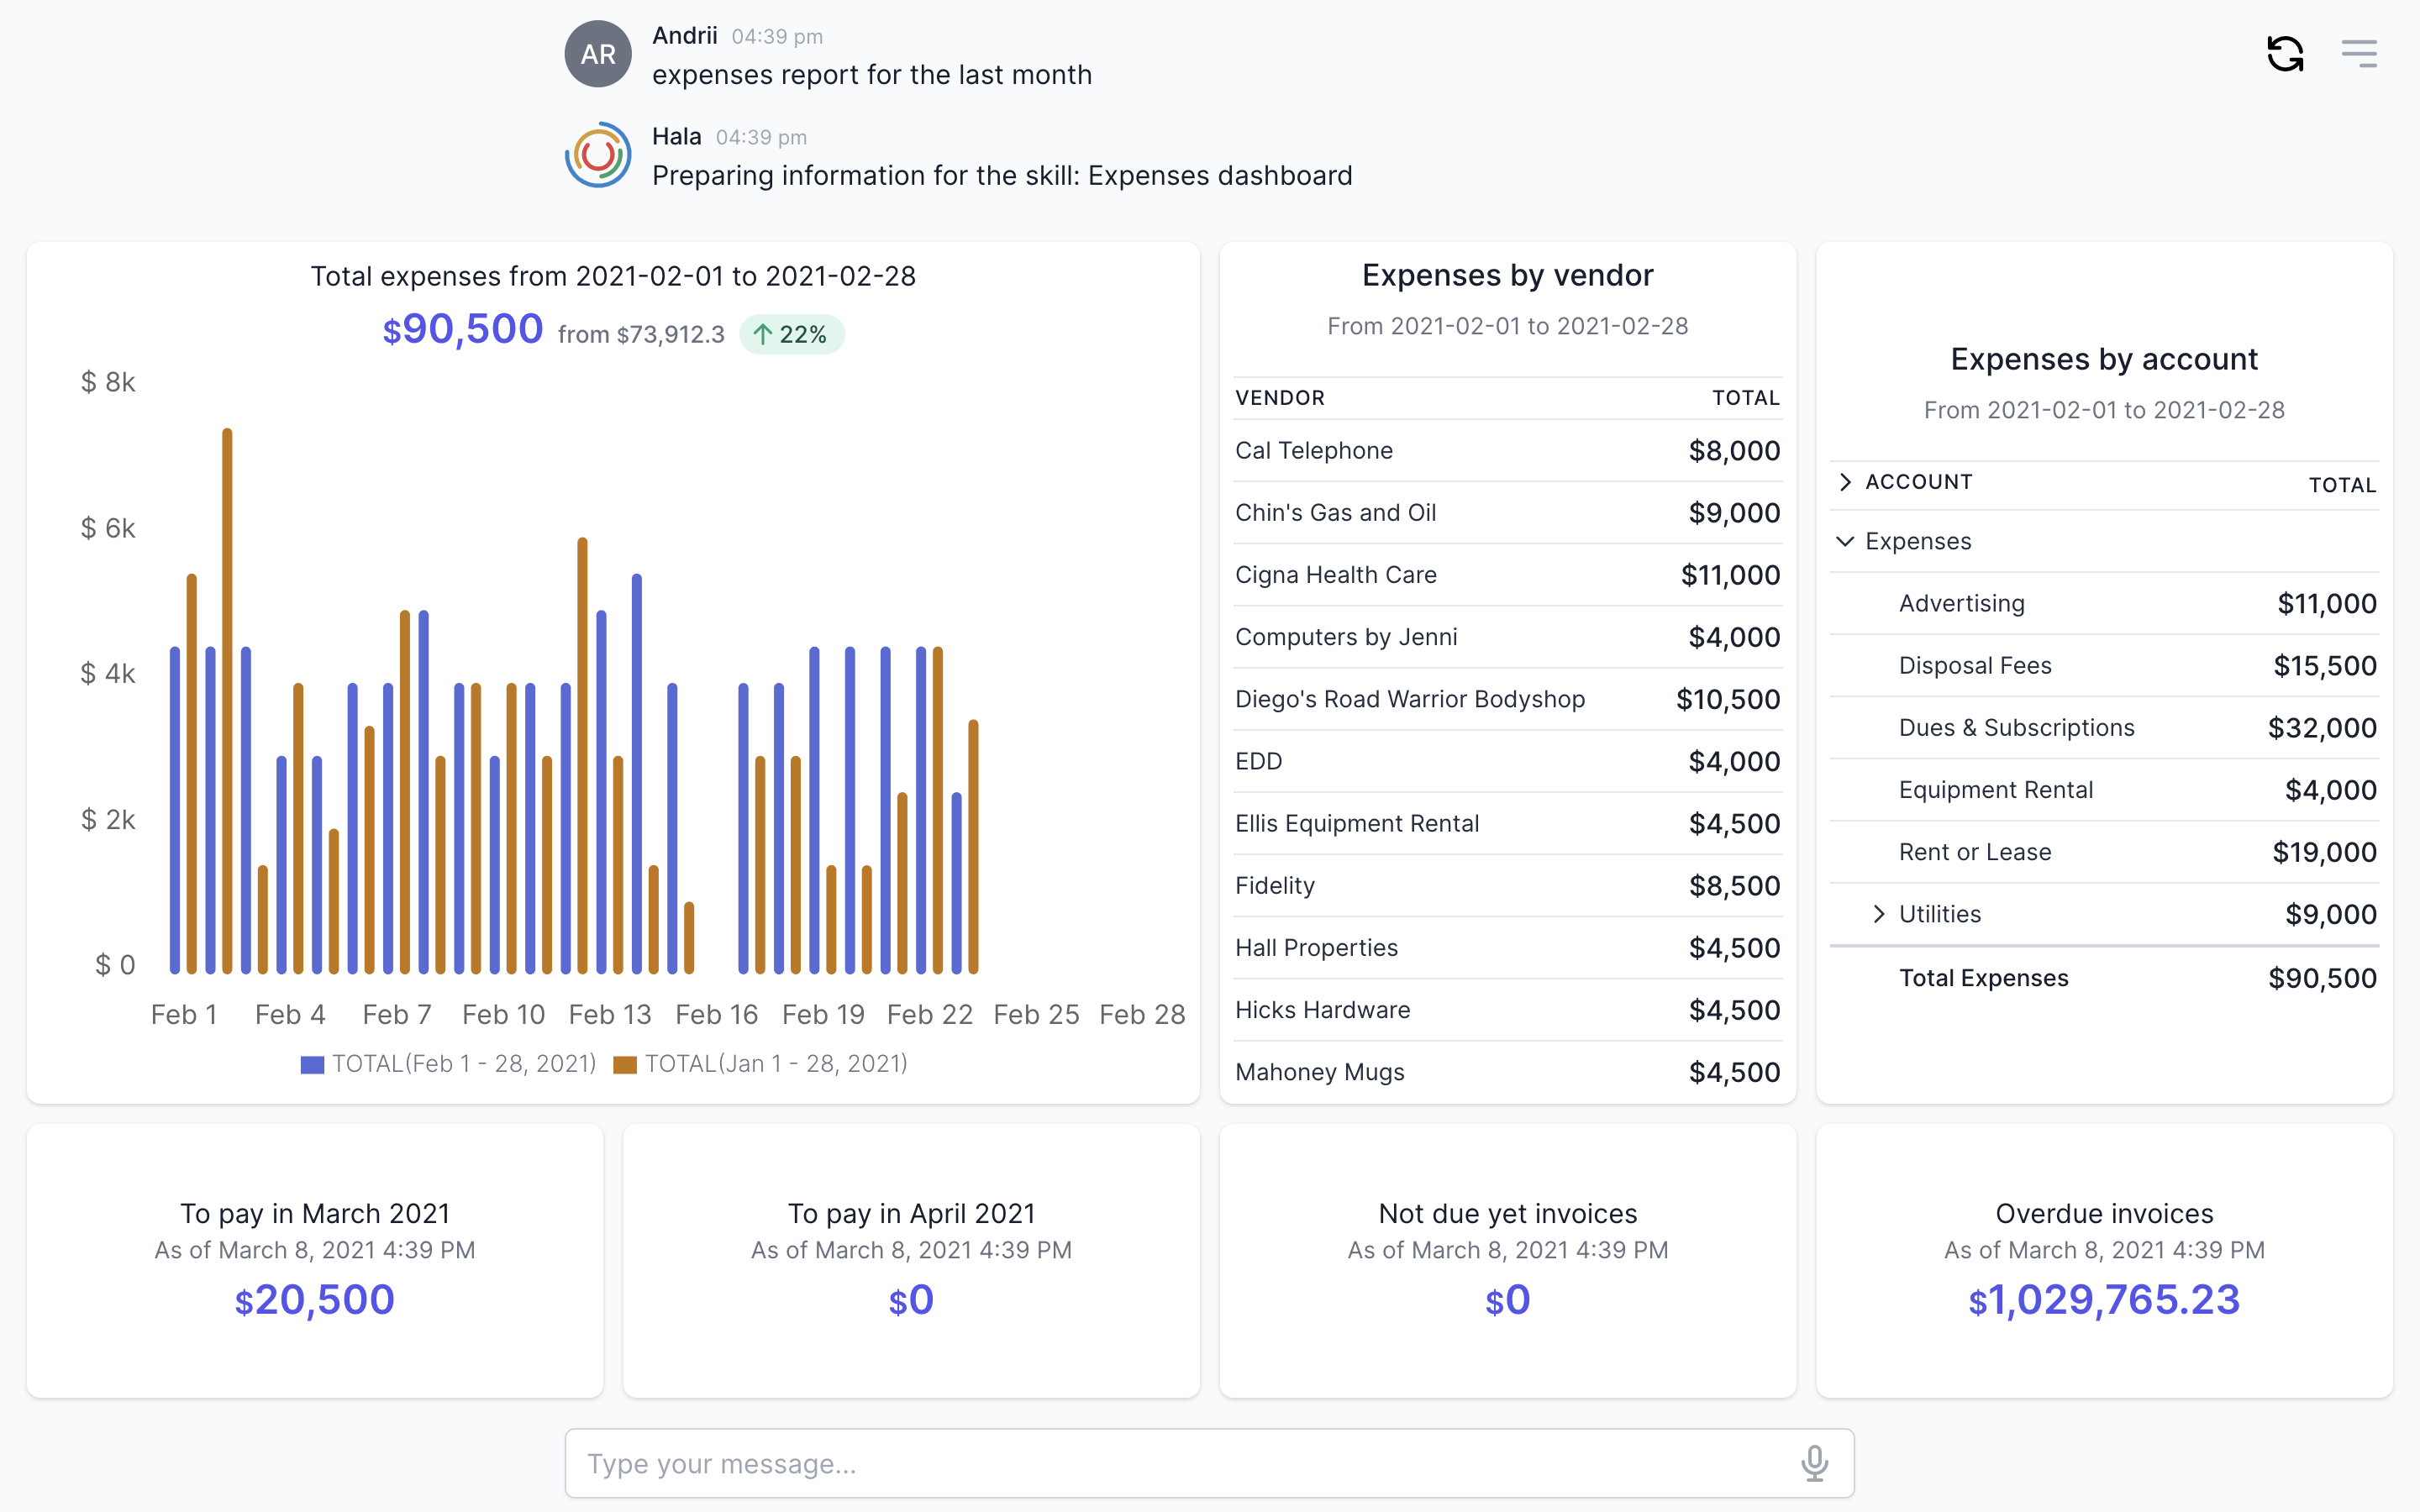
- Histograms: This graph plots a distribution of numbers using a bar chart (with no spaces between the bars), representing the quantity of data that falls within a particular range. This visual makes it easy for an end-user to identify outliers within a given dataset.
- Heat maps: These graphical displays help visualize behavioral data by location.
- Treemaps, which display hierarchical data as a set of nested shapes, typically rectangles. Treemaps are great for comparing the proportions between categories via their area size.
- Lists can display the data in two columns and include the nested items, which can be used as a part of a dashboard.
- Lists can display the data in two columns and include the nested items, which can be used as a part of a dashboard.
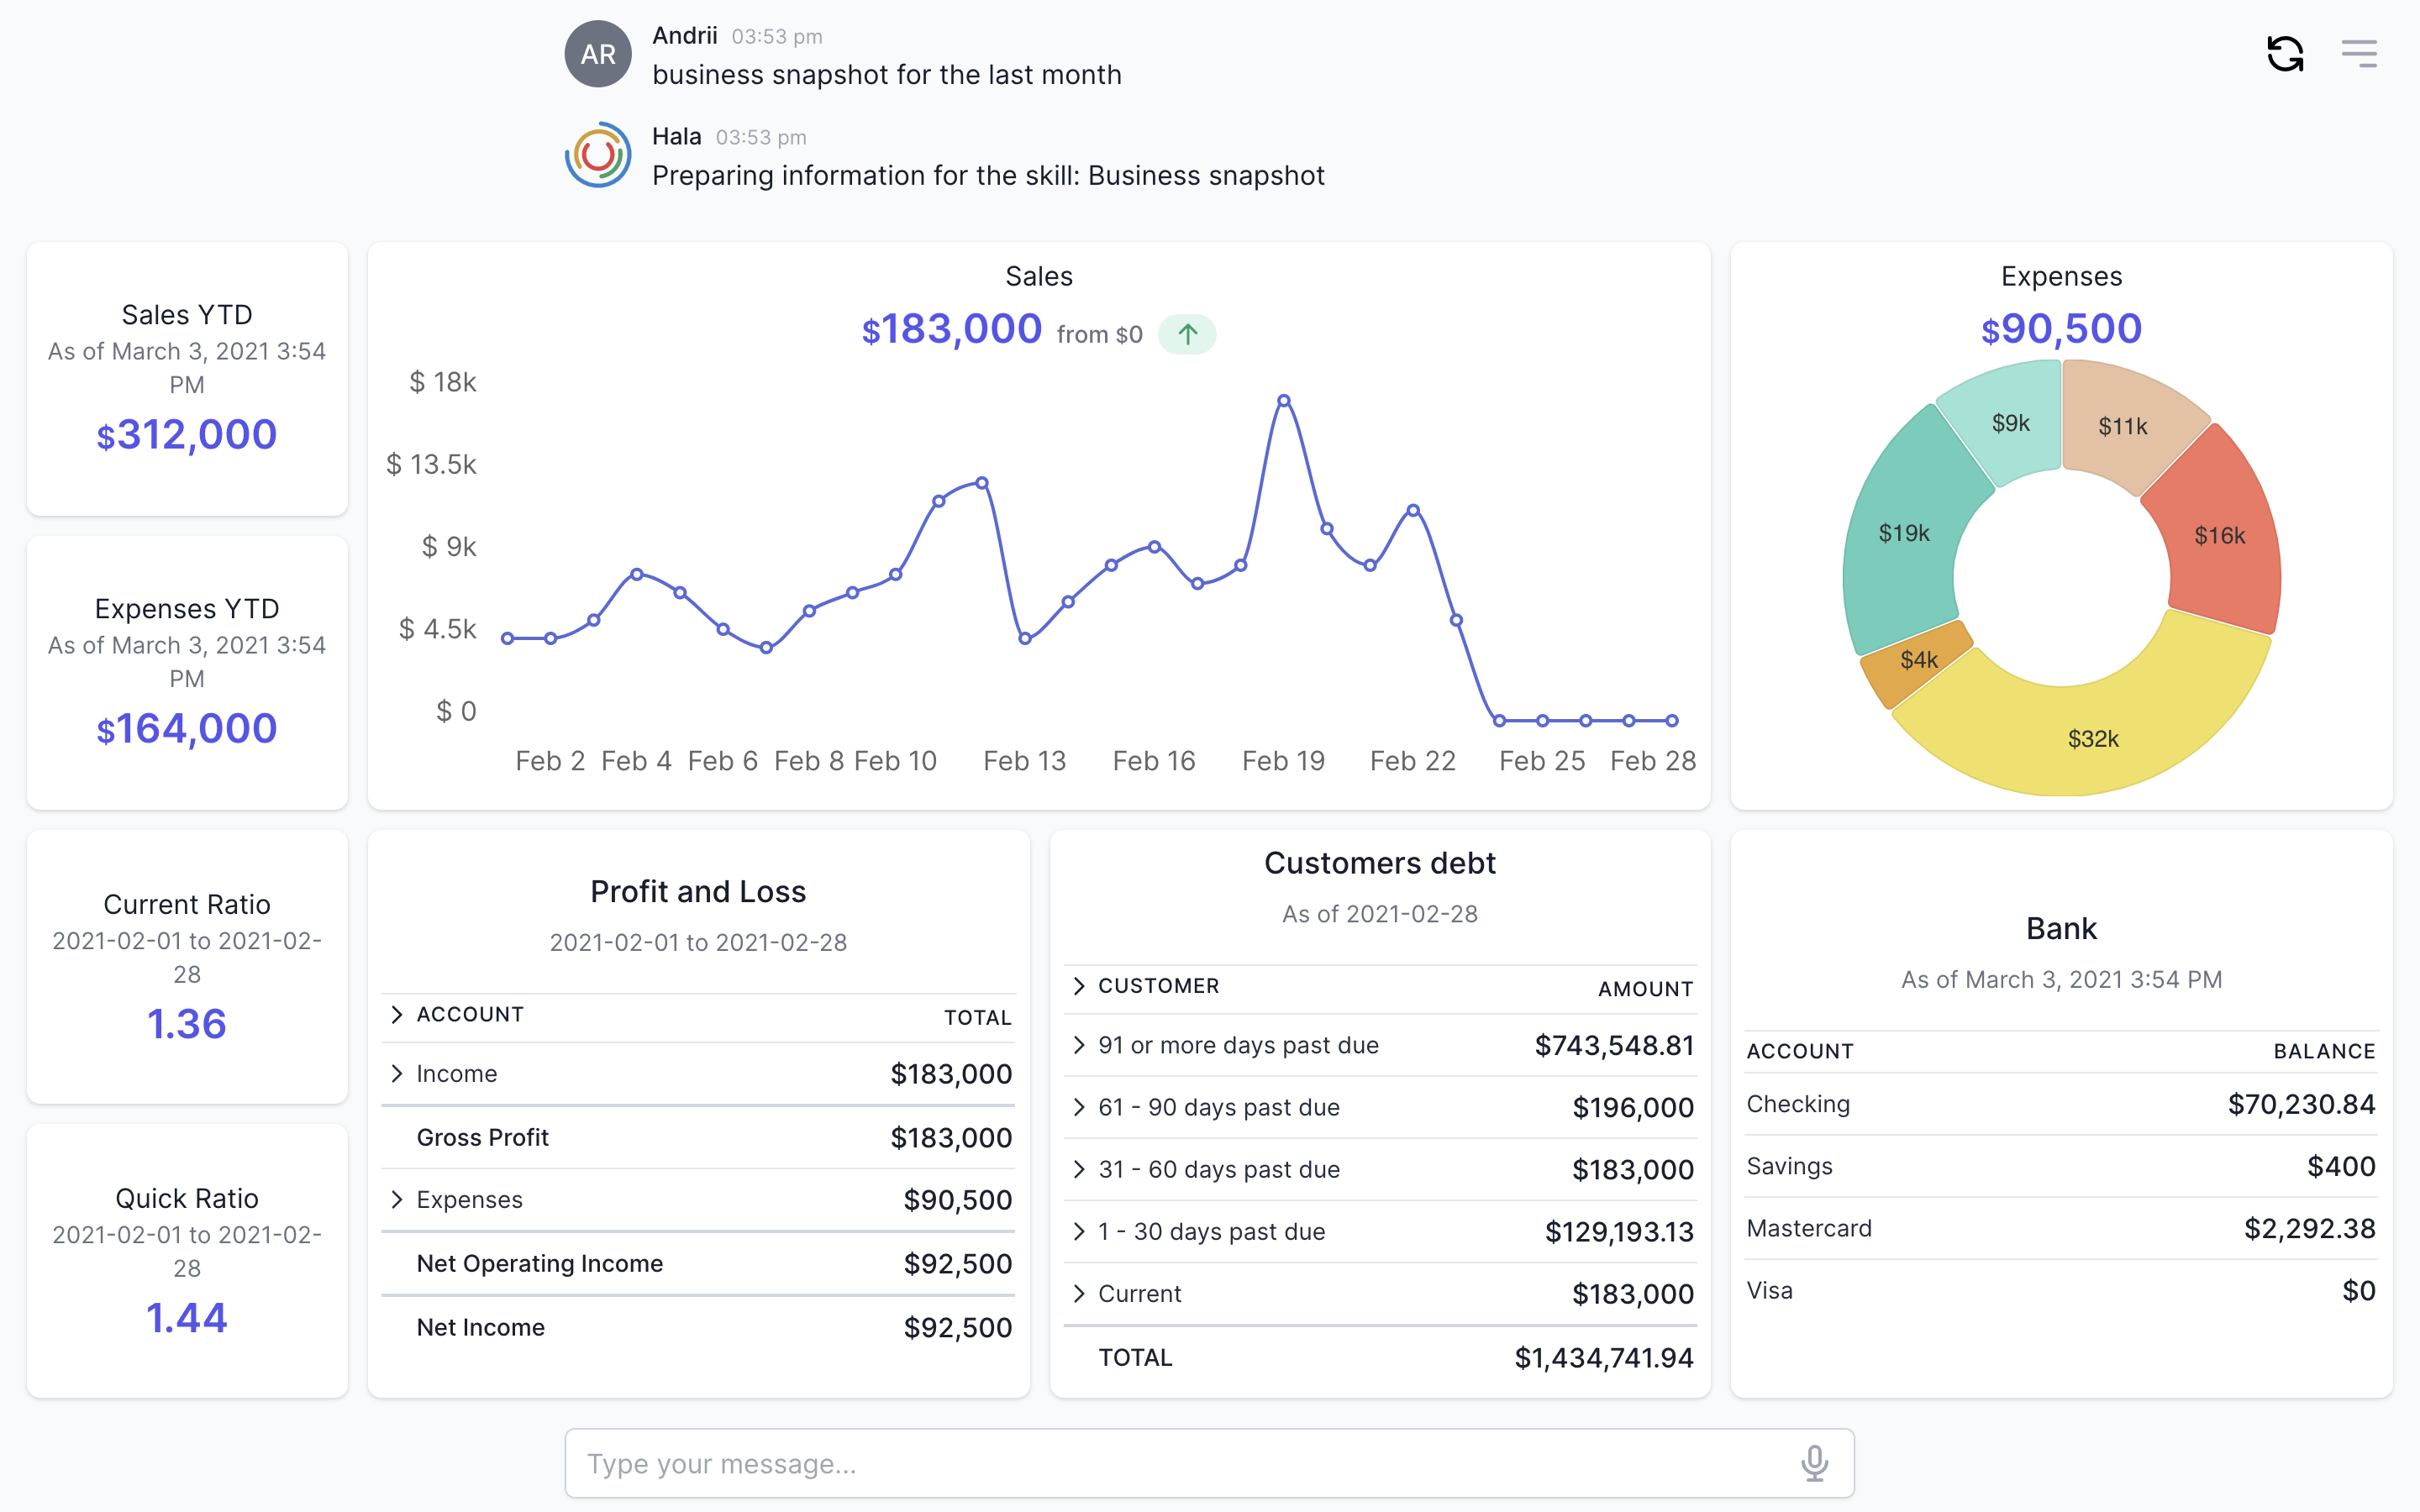
- Stats display the financials or numeric single values of data and can be compared with previous periods to disclose the changes.
Benefits of Conversational BI
Conversational BI, as part of conversational AI, is a cost-efficient solution for many business processes. The following are examples of the benefits of using conversational BI.
-
Simplification in getting the analytics. There is no need to learn new analytics solutions, no need to spend time on learning courses on how to use the tools, and no need for specific applications on your computer. Conversational BI allows using natural language for getting the analytics. Think about this like you are a member of the management team, and you have a personal assistant preparing all the analytics based on your request. You know which analytics tools your organization is using. Still, you do not need to know how exactly how to make a report. You only need the right data on your screen.
-
Self-service analytics. Able to reduce the added cost, complexity, and security risks of multiple solutions with a conversational BI interface that scales from individuals to the organization as a whole. With conversational BI, organizations can get a unique single place for accessing and working with all the data.
-
Analytics in real-time. Provides the opportunity to get the information about the organization activities that are happening now, not just in the past. From IoT data to financial KPIs, users can get access to real-time analytics to make timely decisions.
-
Personalized and enterprise analytics. Get both personalized and enterprise data analytics in a single conversational interface. Not all enterprise analytics meets all employees' needs inside the organizations, all of them have their own responsibilities and KPIs, and they need to personalize analytics to be more productive.
-
Get answers powered by AI. Take advantage of artificial intelligence technologies to find insights quickly from both structured and unstructured data. Ask questions around the data, and get the answers generated by AI based on deep analysis of an enormous number of factors that can influence the data.
Challenges of Conversational BI technologies
Conversational AI is still at the beginning of the road, and widespread business adoption began in recent years. Conversational BI, even not at the beginning of the road, exists as a concept. While many companies are interested in such technologies, there is no mass movement in that direction. As with any new technological advances, there are some challenges with transitioning to conversational AI and BI applications. Some examples include:
-
Challenges of conversational AI technologies. When we are talking about conversational BI technologies, we also need to cover conversational AI challenges because they are strongly dependent on each other. The challenges of conversational AI are more fundamental in that dependencies. Those challenges include, for example, Language input, Privacy & Security, and User apprehension. The biggest challenge for conversational AI is the human factor in language input. Emotions, tone, and sarcasm make it conversational AI difficult to interpret the intended user meaning and respond appropriately.
-
Focus on customer VS Focus on employees. Nowadays, many companies see the biggest value of applying conversational AI technologies in customer faced communications, empowering sales teams and IT support departments. There are the reasons for this - increase the revenue, and for IT support is to reduce the cost. Also, it is much simpler to calculate the ROI of implementing new technologies for those areas. Still, the rest of the employees working in Finance, HR, Supply Chain, Production, Marketing, and other departments cannot use conversational AI technologies. They have the same importance for the organization as sales teams or customer support teams, but those departments are not priority number one. Conversational AI technologies can be used not only for sales teams and customer support teams for getting fast results. They can bring more sustainable and fundamental changes and improvements into the whole organization and help all the employees be more efficient.
Hala and Conversational BI
Hala is an AI-development platform that created a Conversational UI framework for bringing all the necessary tools together to develop and implement conversational BI solutions. When Conversational UI was first released in 2017, it merely supported a few UI components like text, image, video, and quick reply buttons. Now it is a sophisticated tool that includes more than 30 UI components to display the charts, reports, dashboards, tables, forms, cards, lists, and other UI components for enterprise users. The Hala solution also integrates with the enterprise software for retrieving, aggregating, cleaning, and analyzing the data.