Tables with data comparison view
Allows comparing several data sets, in case data comes from the several APIs responses.
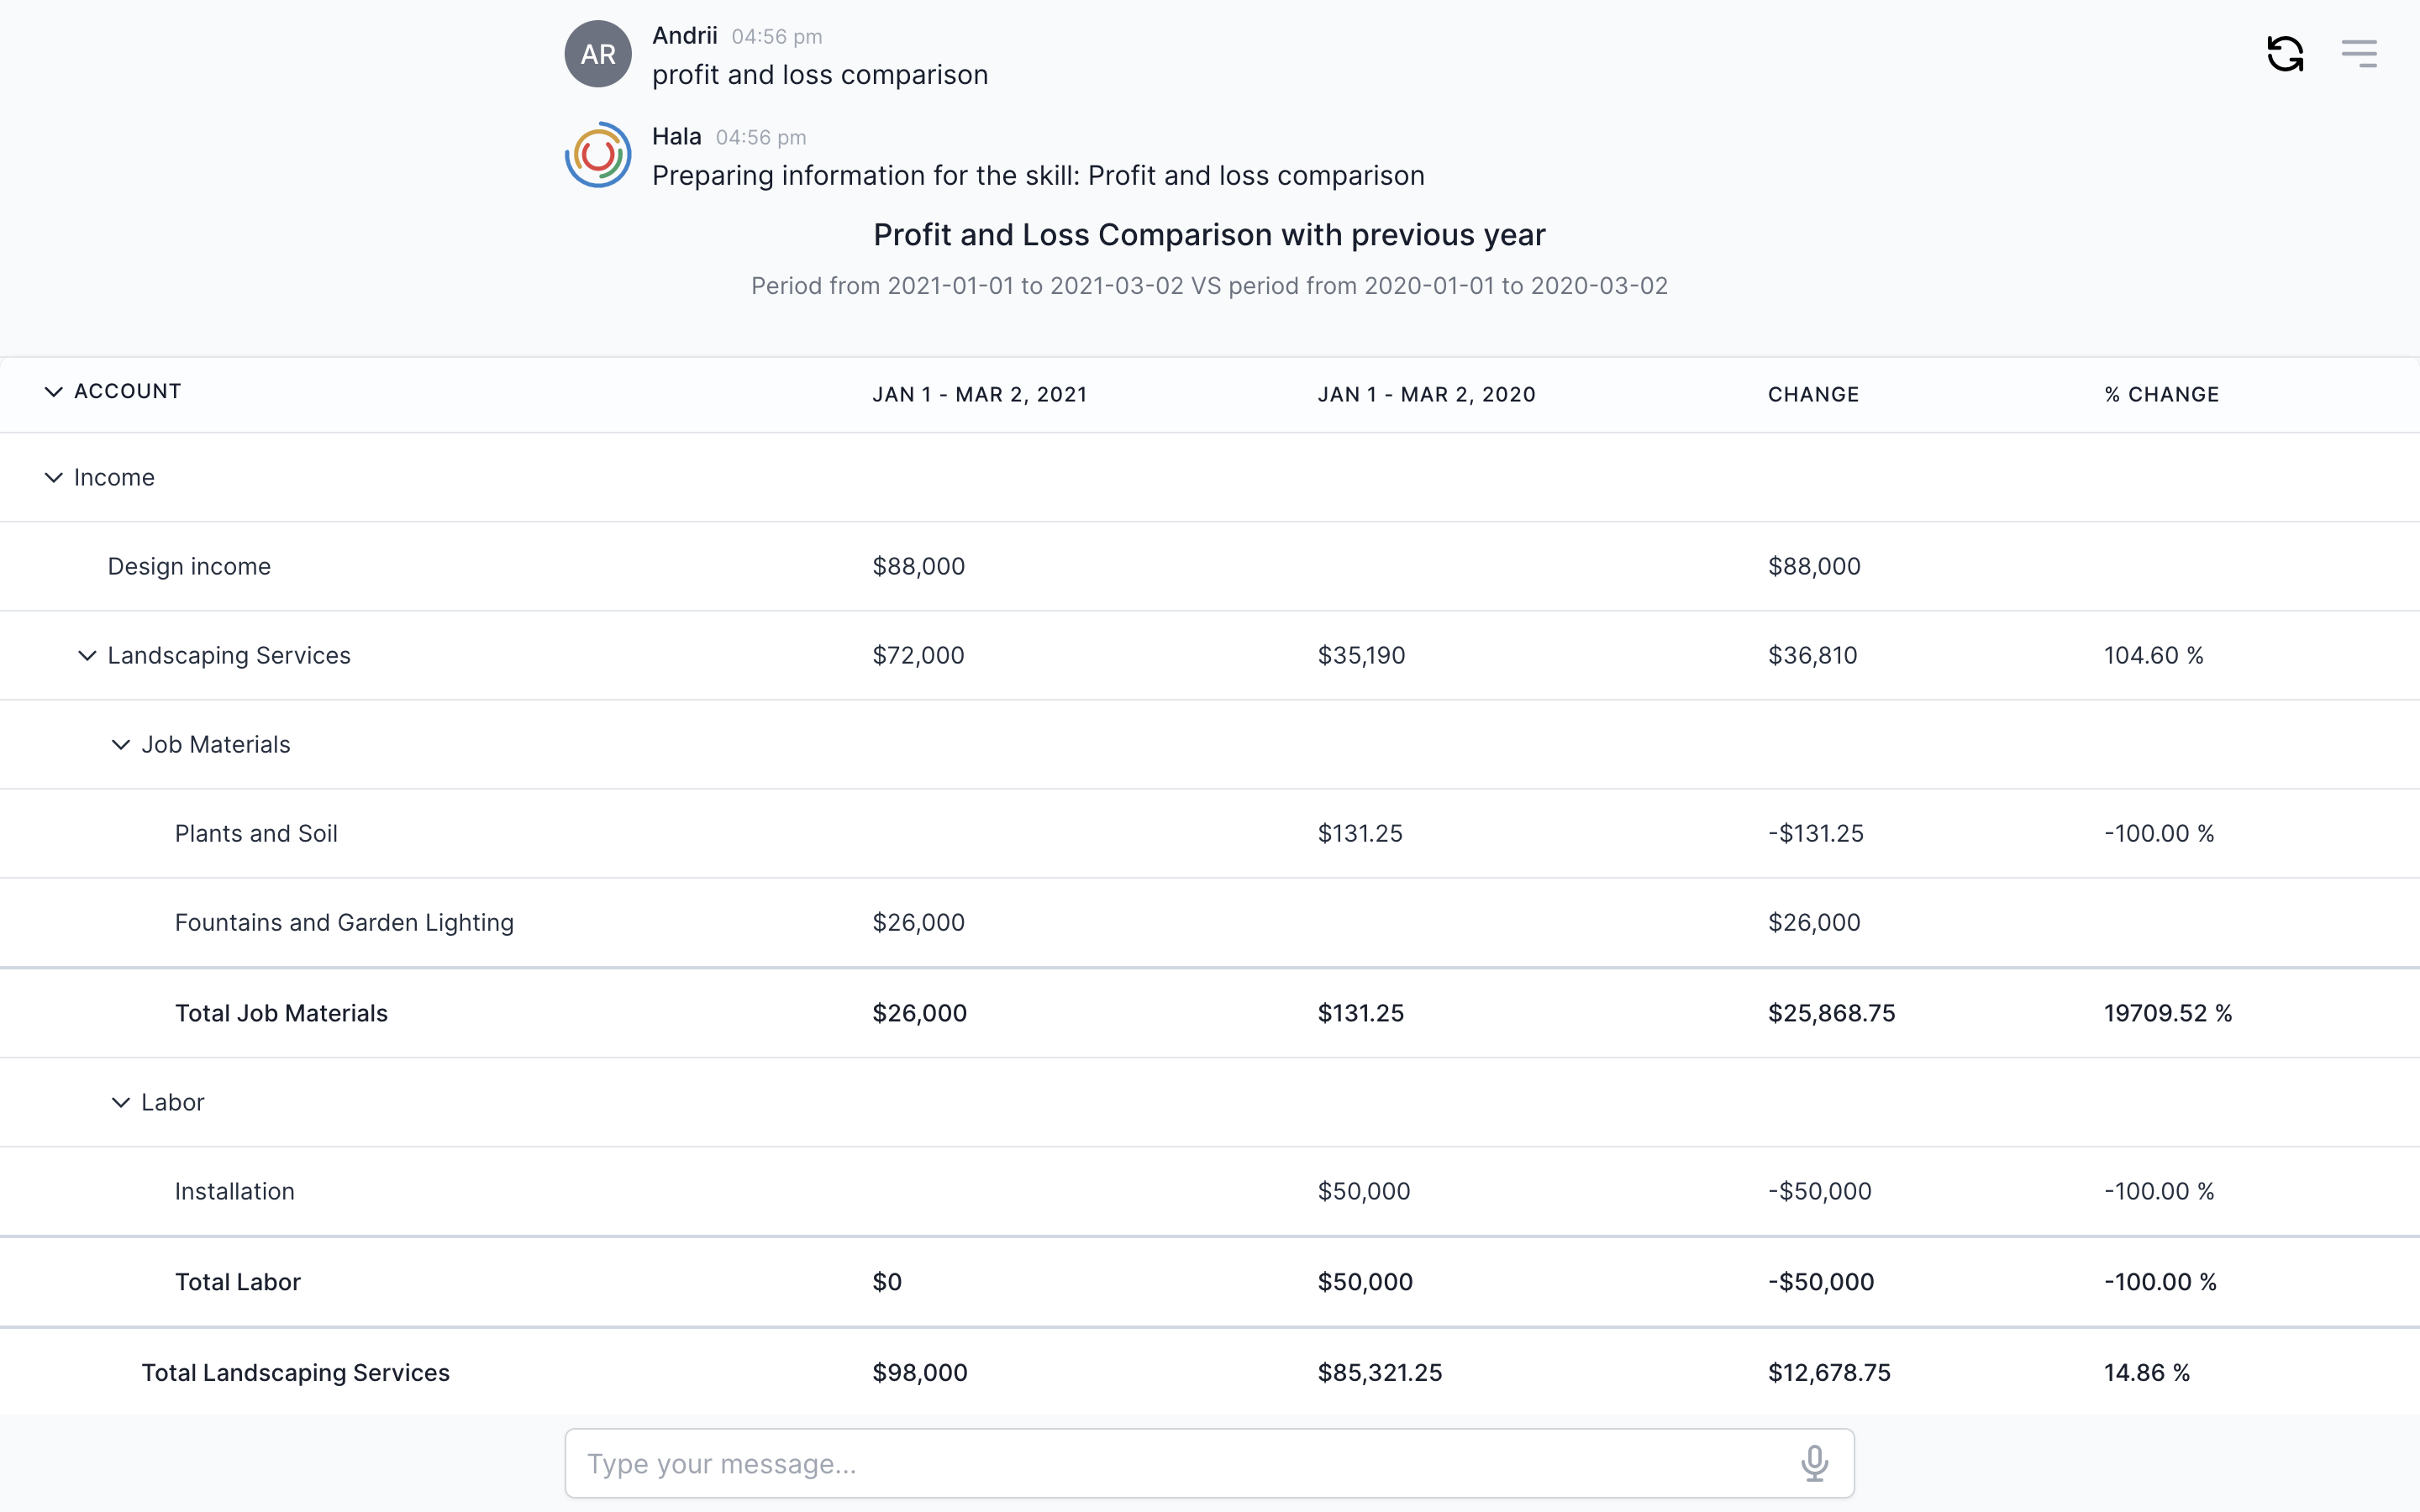
Example
Here’s an example of a table with the comparison view.
Why to use?
It is not a common requirement from the users and, in many cases, would be used by the users who are working with financial data.
The story behind adding that functionality was next - Some time back, we design the process automation for the accounting department, and for this, we have been using conversational AI. Initially, we have designed the digital skills to get the balance sheet information from the accounting software and added the financial ratio calculations. With that digital skills, accountants were able to get the balance and work with it. Later accountants said that it is essential to analyze the balance sheets in comparison with previous periods. To meet such requirements, we have added the comparison options, and now the accountants can analyze the data for several periods and see the changes.
Guidance
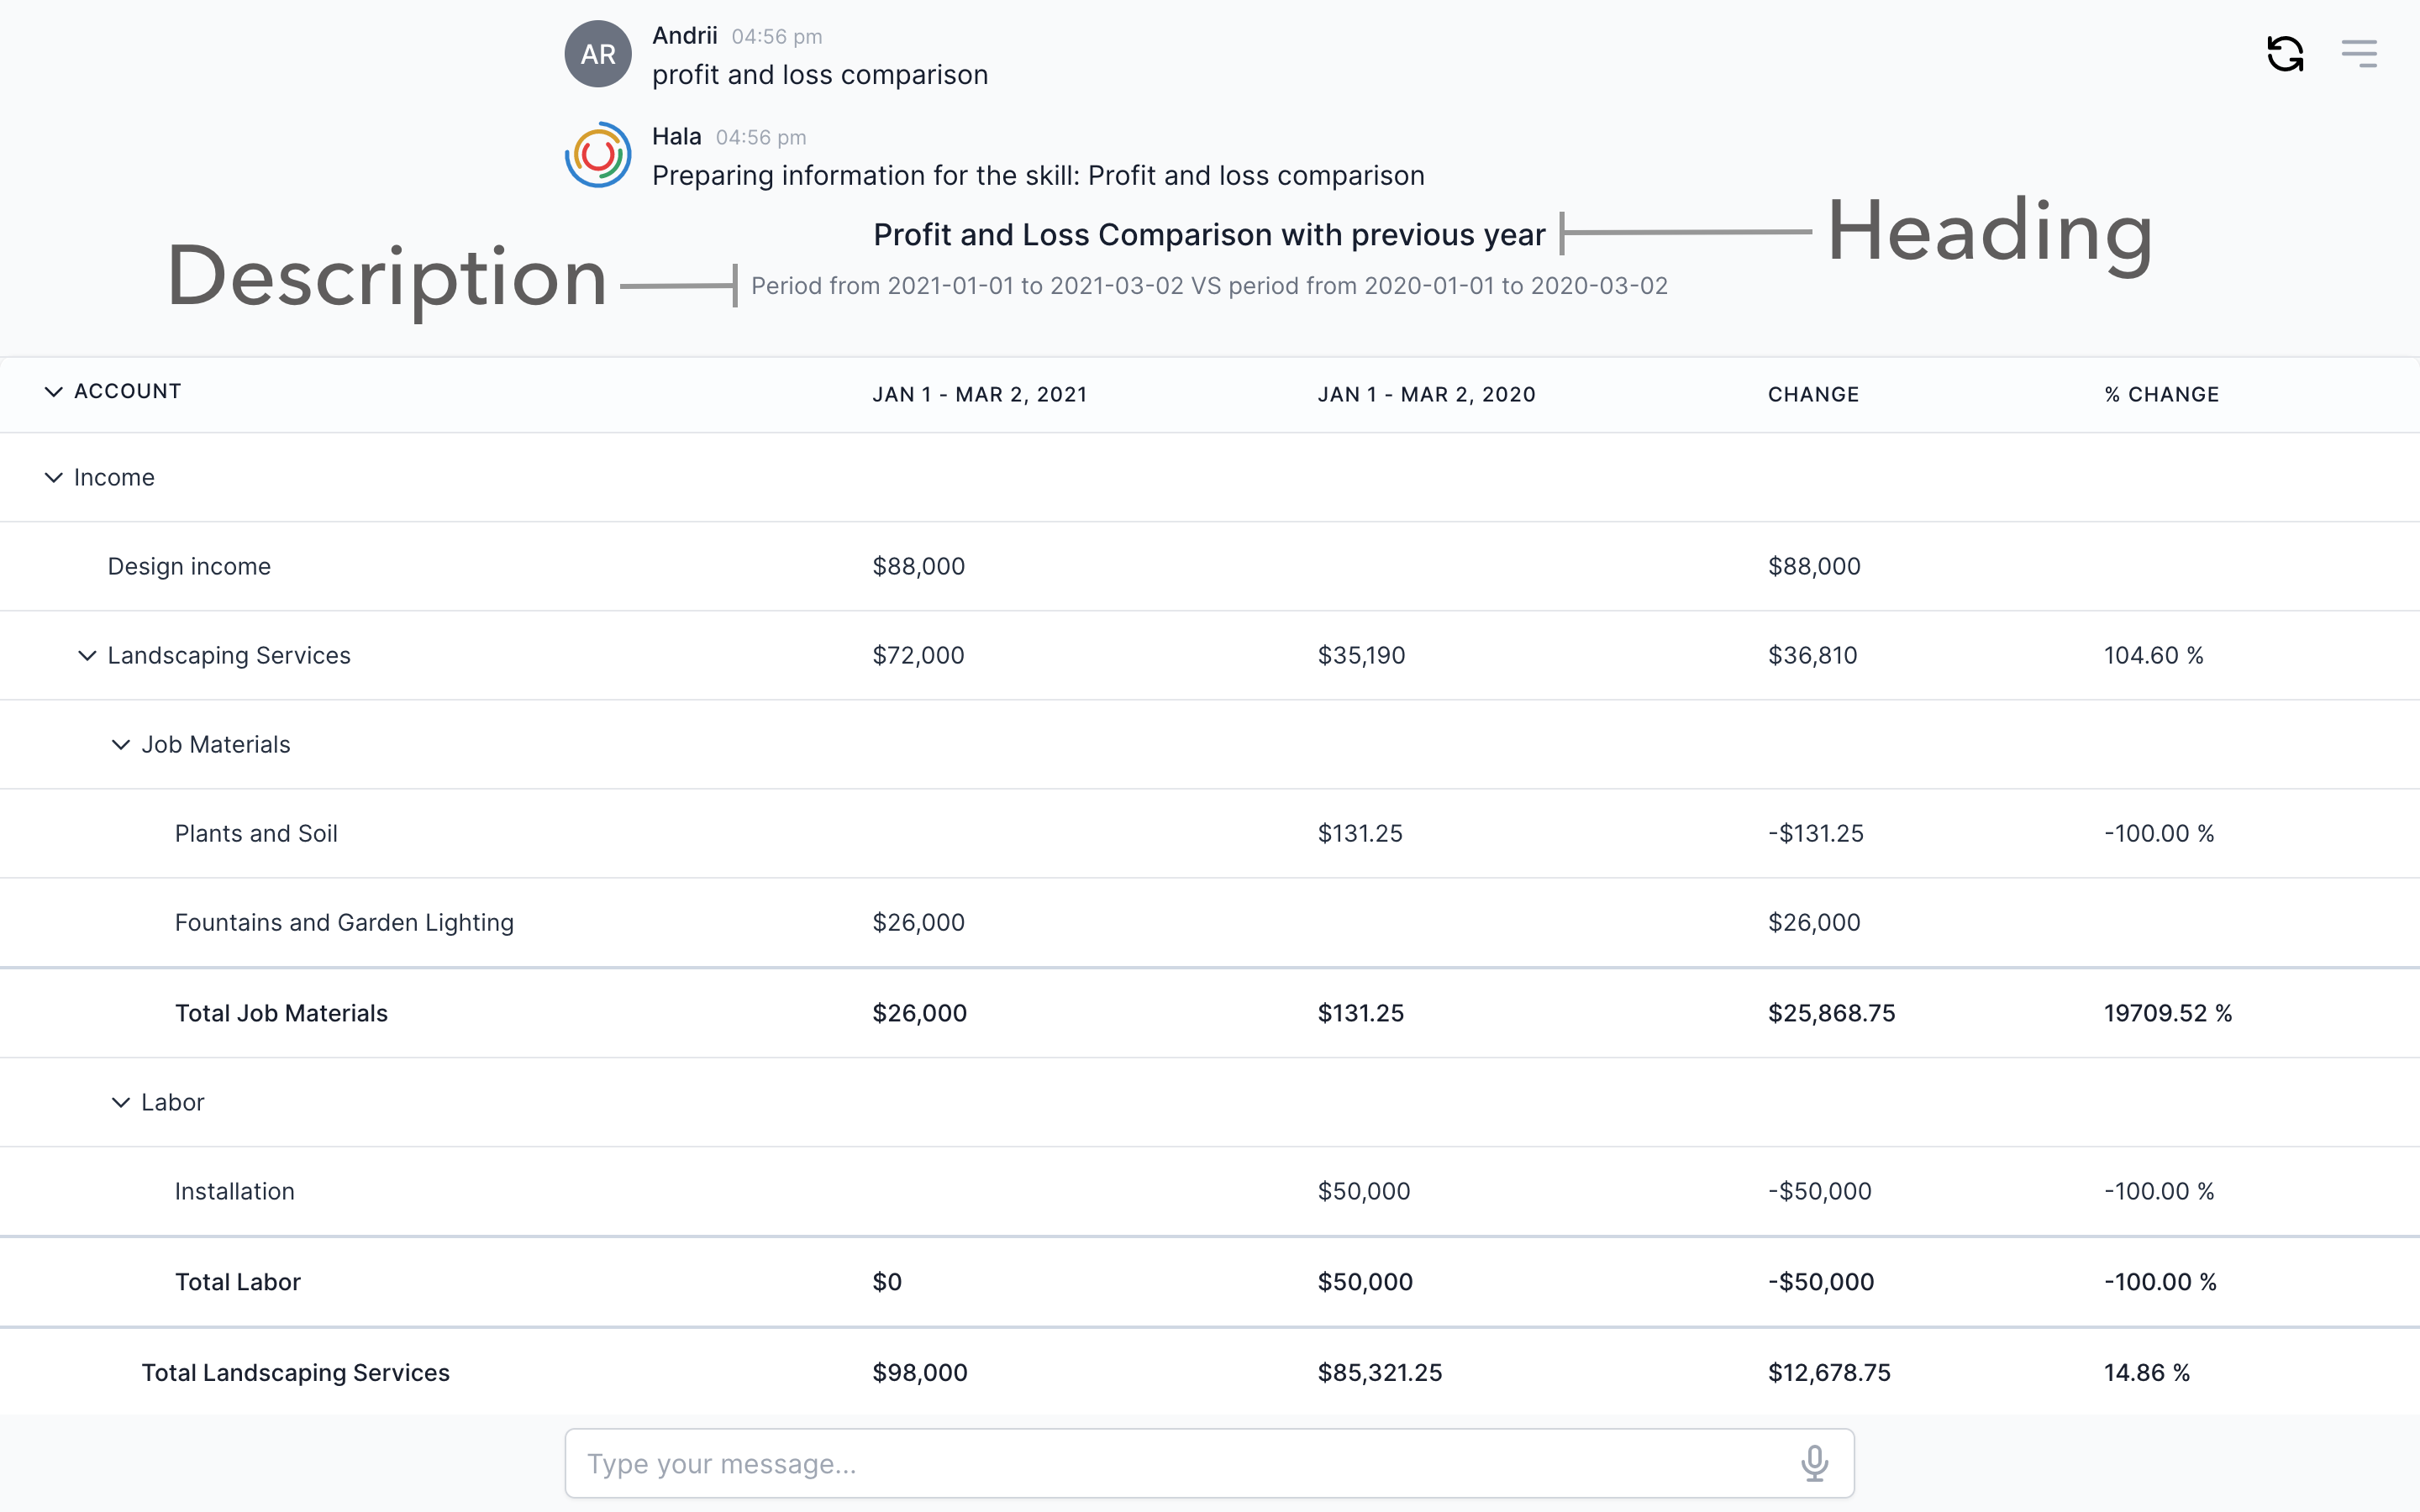
Header and description
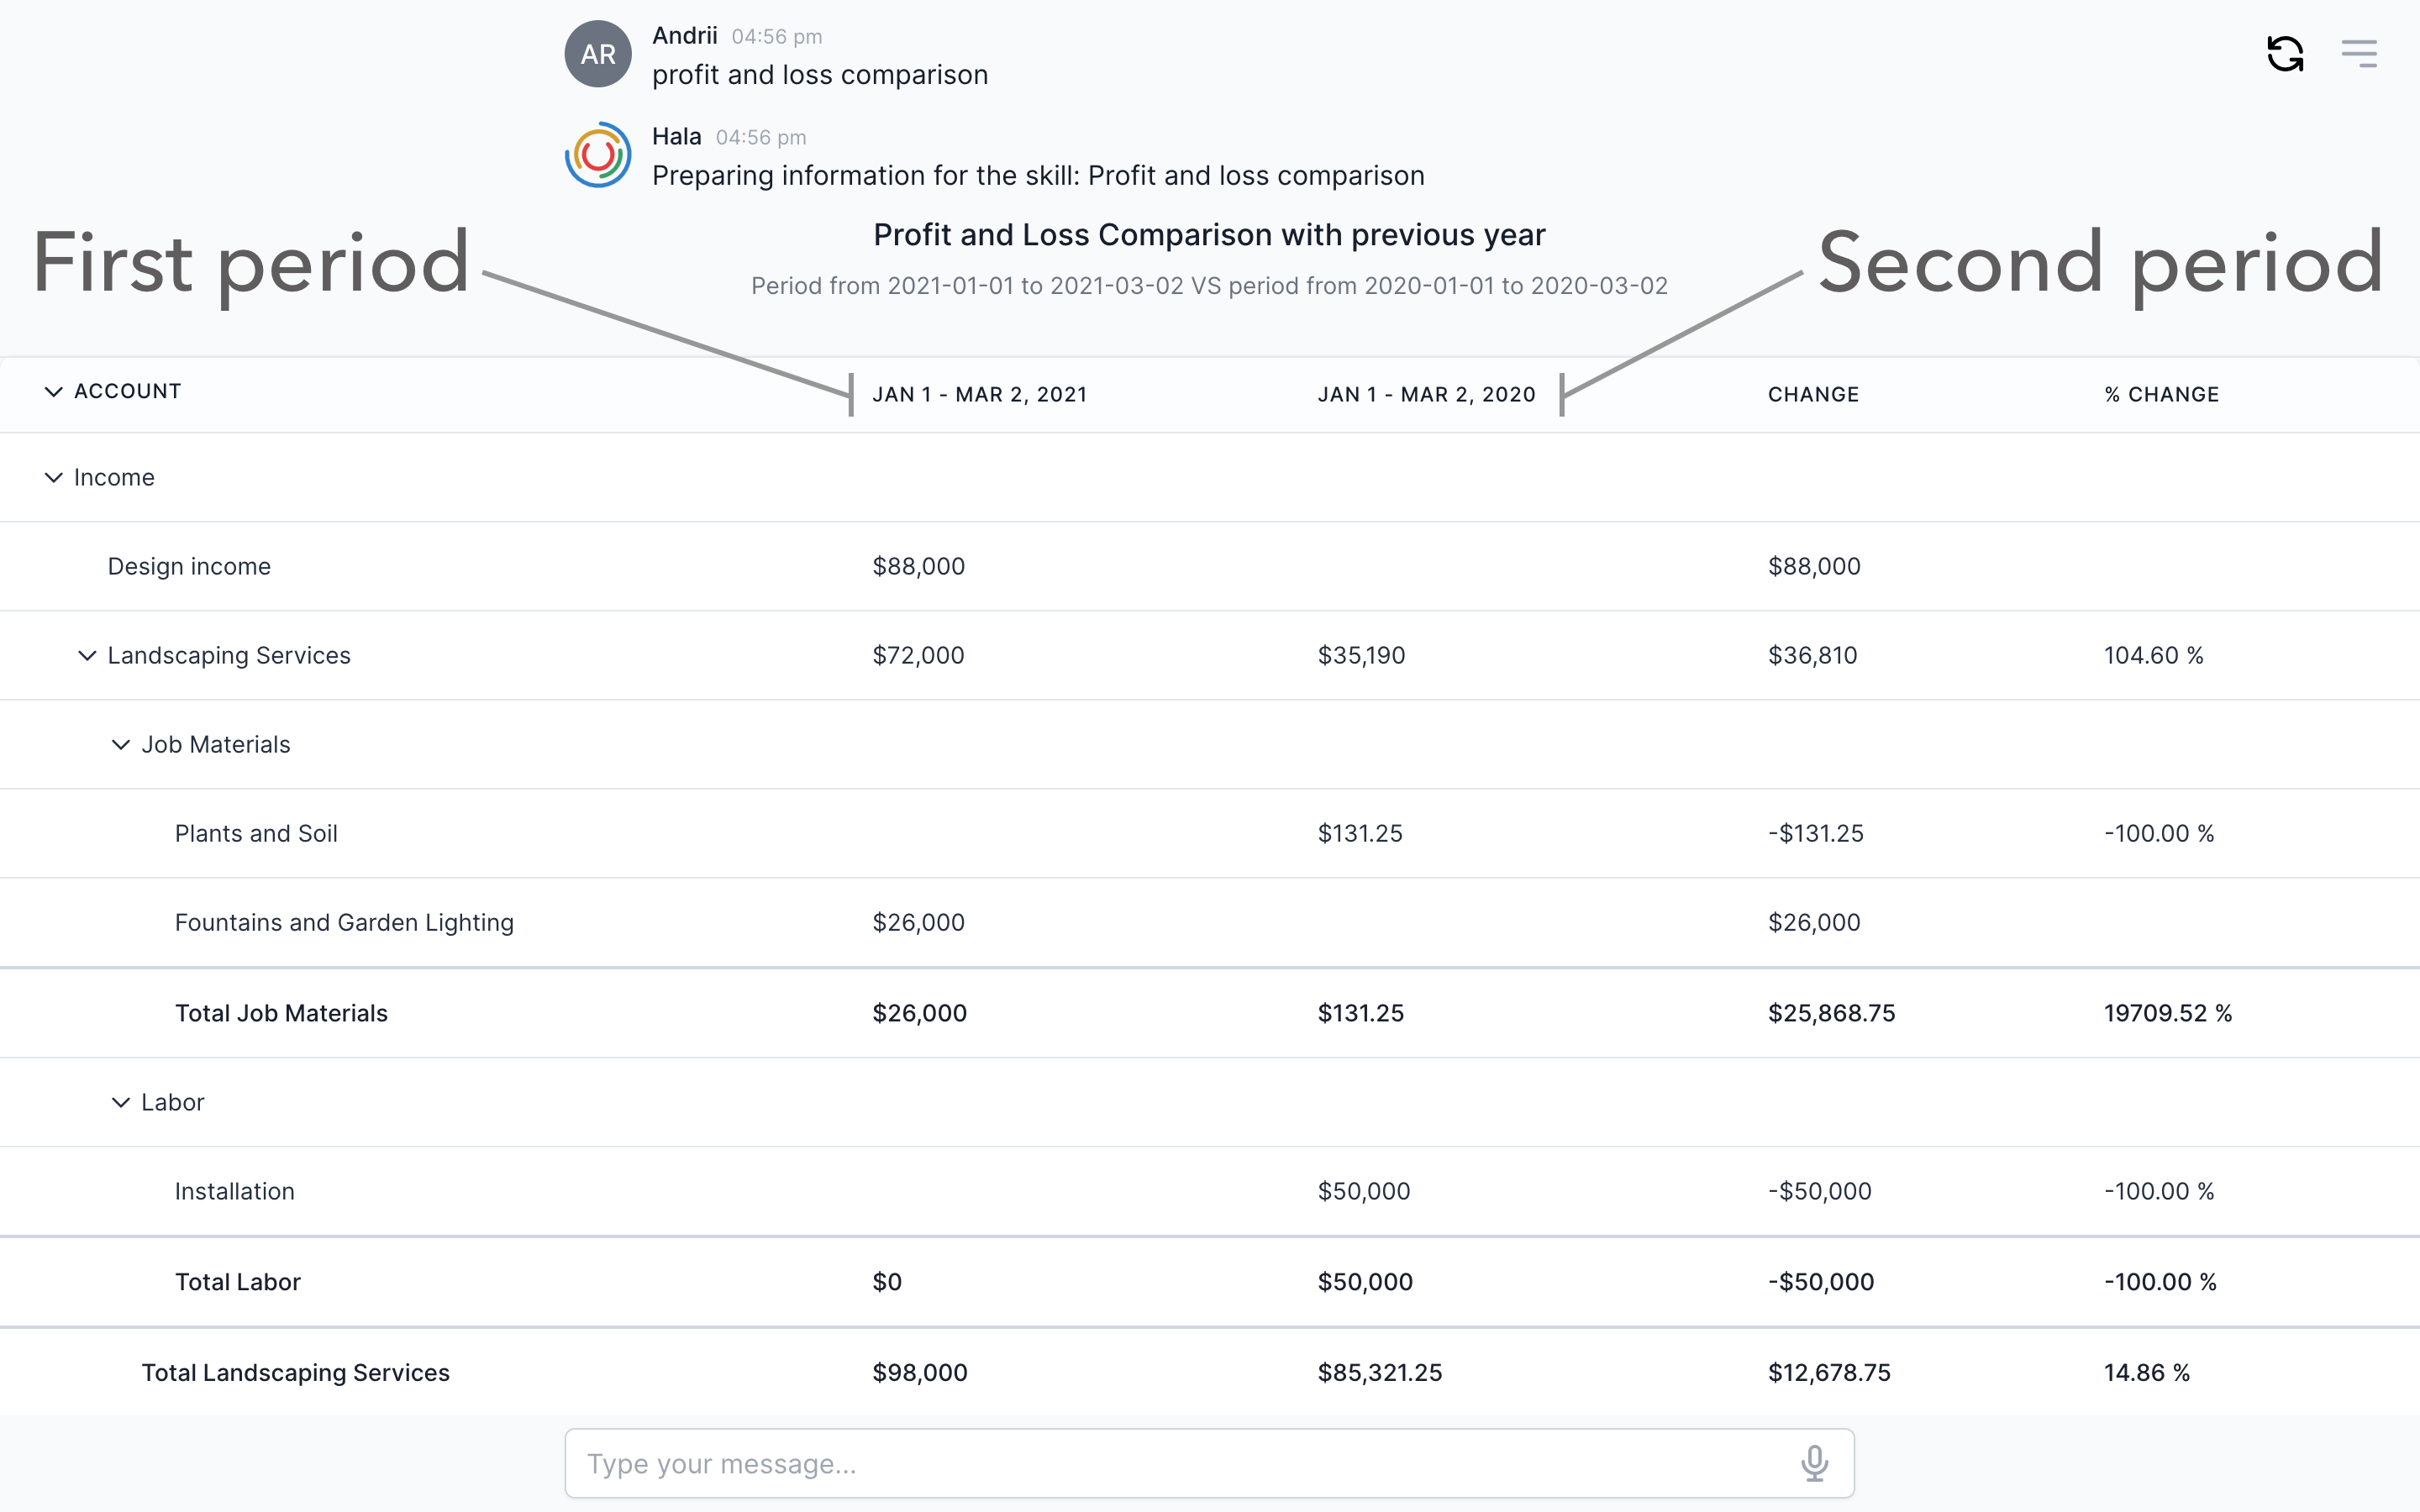
Number of periods to compare
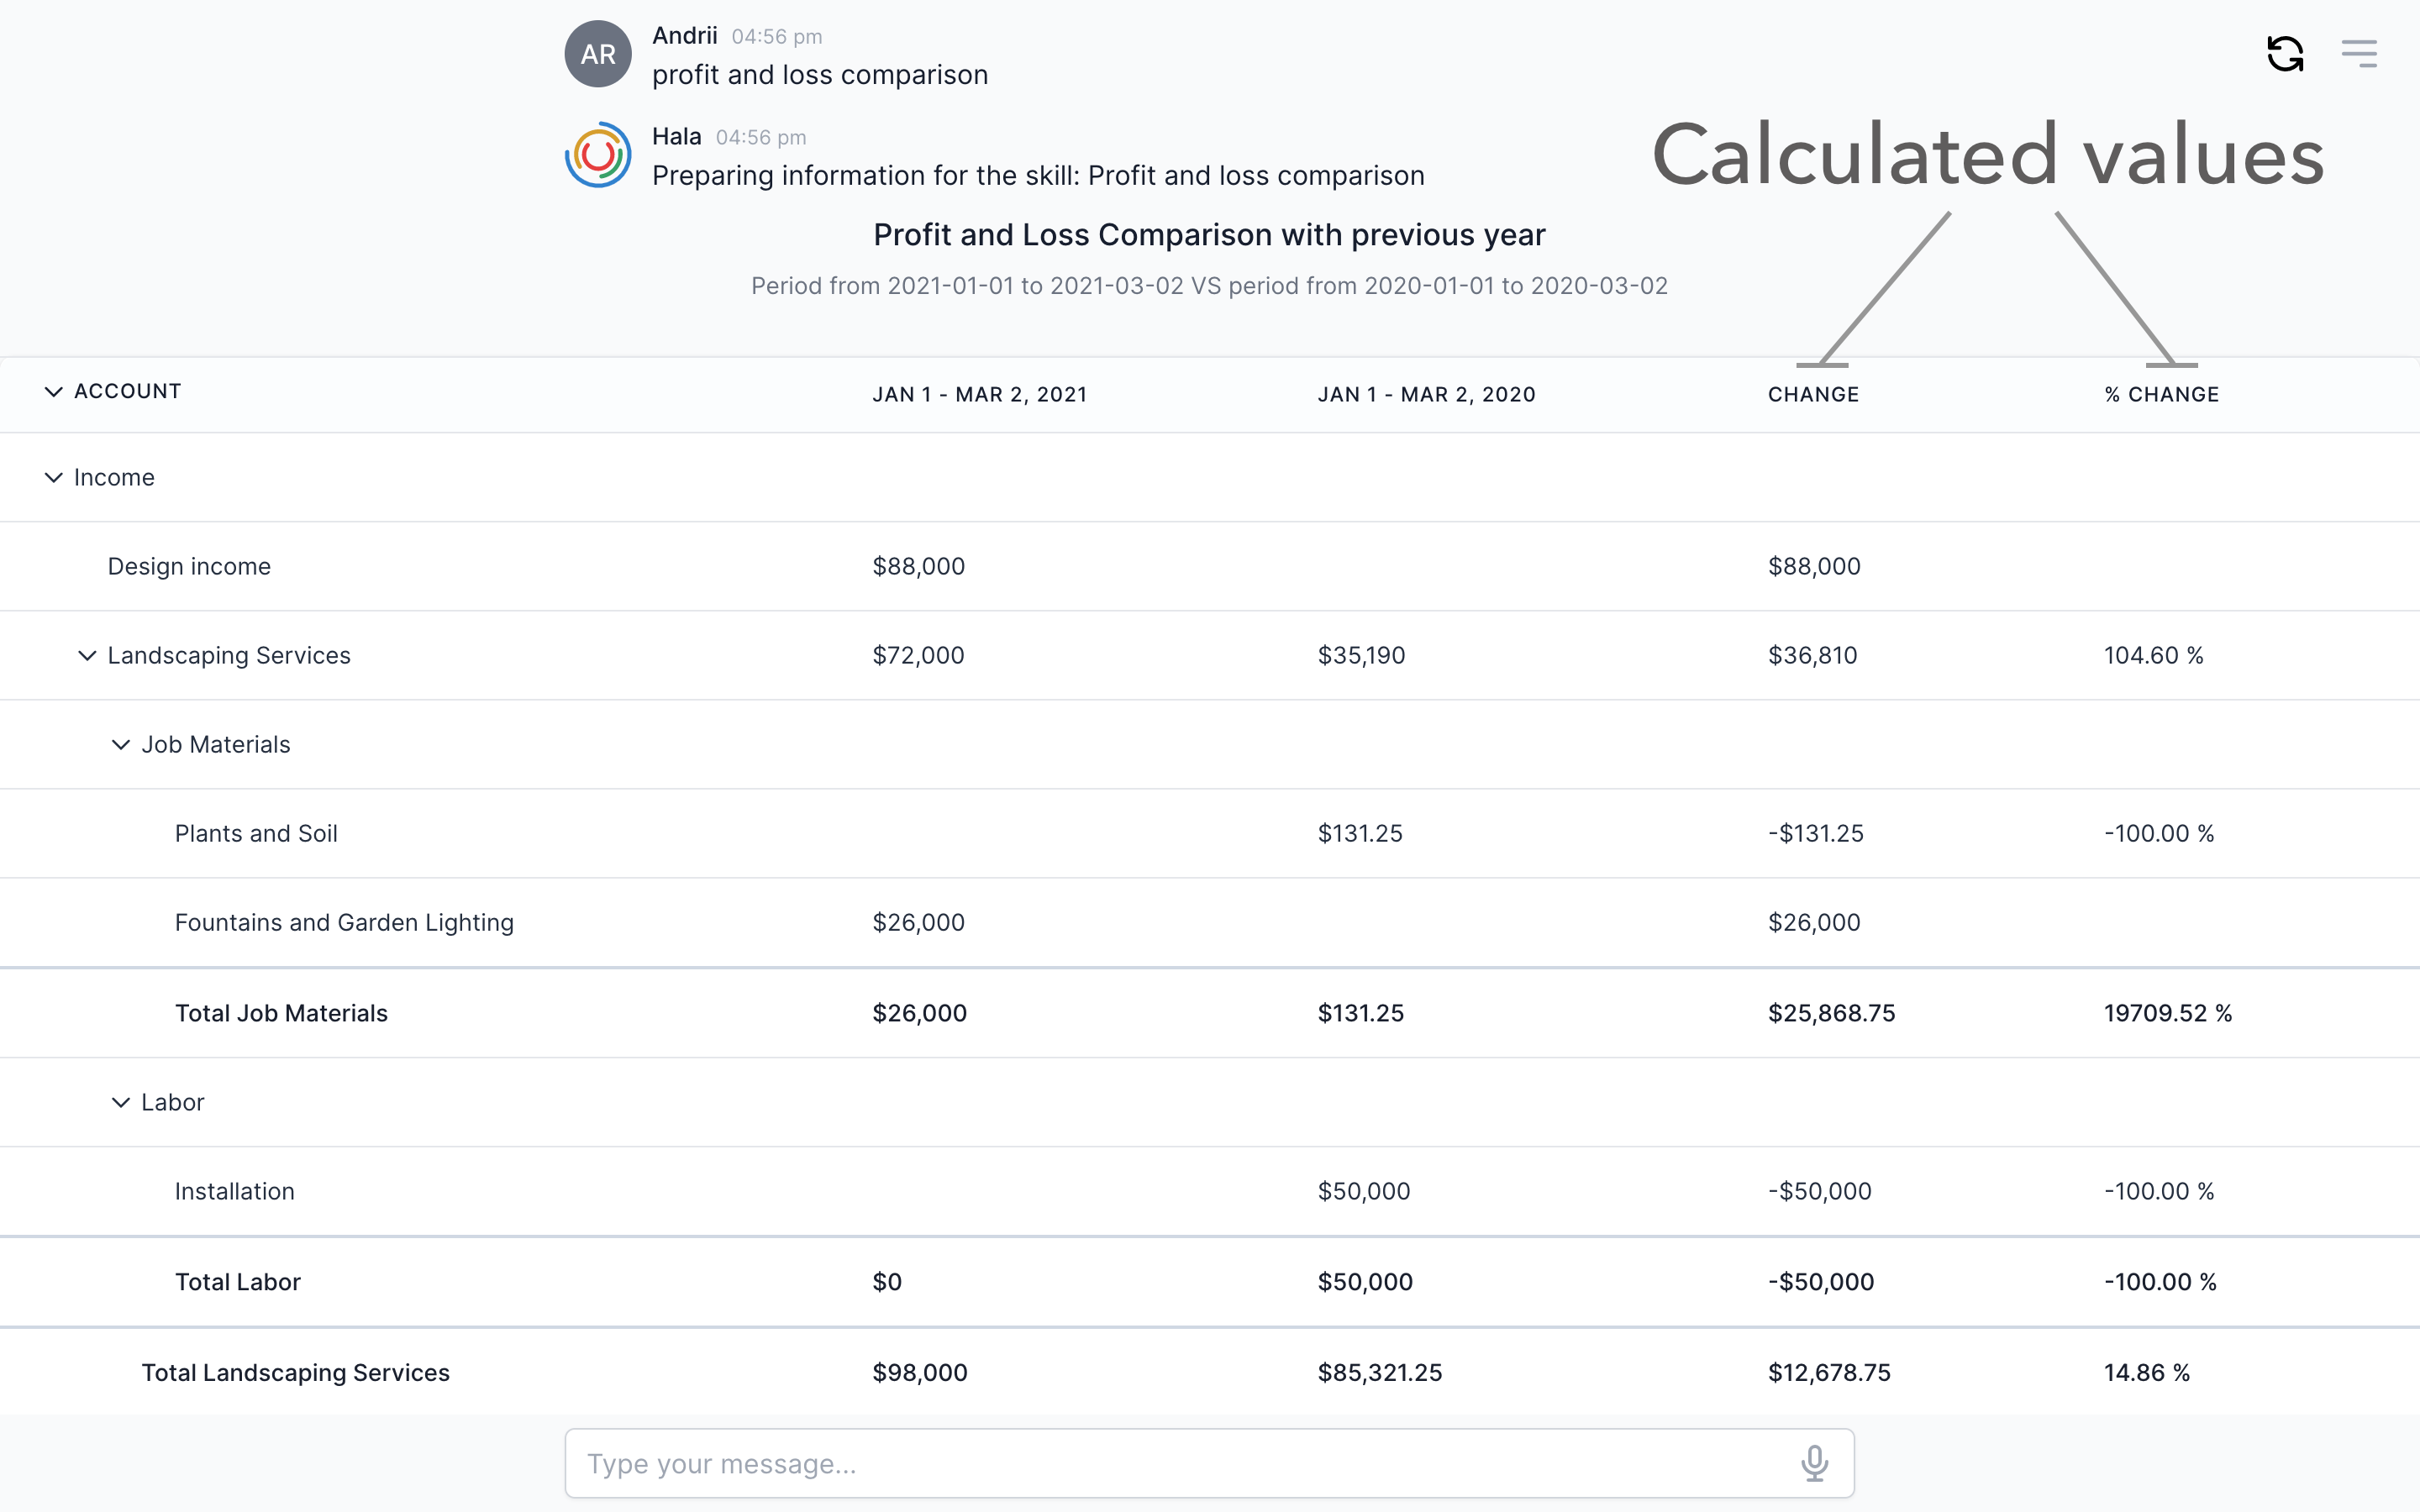
Add calculations
How to use
You can find more information about using this component here.